
You checked PageSpeed Insights or Search Console and got the bad news: Core Web Vitals assessment failed. Now you're staring at LCP, INP, and CLS scores wondering what actually broke and whether it's tanking your rankings or conversions. It's a common problem, especially on ecommerce storefronts loaded with third-party scripts, large product images, and dynamic content that shifts around while shoppers try to click.
A failed core web vitals issue almost always traces back to a handful of root causes: unoptimized images, render-blocking JavaScript, slow server response times, or layout instability from ads and dynamically injected elements. The fix isn't guesswork. It's identifying which metric is failing, diagnosing the specific culprit on your storefront, and applying targeted changes, whether that's image compression, code splitting, or reserving space for dynamic content before it loads.
This guide walks through exactly how to diagnose a core web vitals assessment: failed result and fix each metric one by one. We'll cover the tools to pinpoint the problem, the technical fixes that move the needle fastest, and why edge-based speed optimization (like what we run at Nostra AI across 300+ ecommerce brands) can resolve many of these issues without touching your codebase or replatforming.**
When Search Console or PageSpeed Insights tells you your Core Web Vitals assessment failed, it's not flagging a stylistic preference. It's reporting that real visitors on your storefront experienced slow loading, laggy interactions, or jumpy layouts often enough that Google's field data crossed a defined threshold. This isn't a lab test you can game with a single fast page load. It's an aggregate of actual Chrome user data collected over a rolling 28-day window, which means the fix has to change what real shoppers experience, not just what a synthetic test reports.
Three metrics decide whether you pass or fail, and here is what each one actually measures: Largest Contentful Paint (LCP) measures how long it takes the biggest visible element (usually a hero image or product photo) to render. Interaction to Next Paint (INP) measures how responsive your site feels when someone clicks an "Add to Cart" button or opens a menu. Cumulative Layout Shift (CLS) measures how much content jumps around while the page loads, like when a banner pushes your checkout button down right as a shopper taps it. Google scores each metric at the 75th percentile across your traffic, meaning three out of four visits need to hit "Good" for you to pass.
| Metric | Good | Needs Improvement | Poor |
|---|---|---|---|
| LCP | ≤ 2.5s | 2.5s - 4.0s | > 4.0s |
| INP | ≤ 200ms | 200ms - 500ms | > 500ms |
| CLS | ≤ 0.1 | 0.1 - 0.25 | > 0.25 |
Google only needs one of the three metrics to slip into "Poor" territory for enough visits to mark the whole URL group as failed. That's why a store can have a snappy homepage but still fail overall if product pages loaded with heavy image carousels drag LCP into the red. Segmenting by page template (home, collection, product detail, checkout) matters more than looking at a single site-wide average, because the root cause and the fix usually differ page to page.
A failed Core Web Vitals assessment means real shoppers, not a lab test, hit a slow or unstable page often enough for Google to notice.
Beyond the SEO signal, a failing score correlates directly with lost revenue on ecommerce sites, since page speed shapes conversion rate at every step. Slow LCP means shoppers bounce before they see your product. Poor INP means frustrated clicks on "Add to Cart" that don't register, sometimes generating duplicate orders or abandoned carts. Unstable CLS means misclicks on ads or navigation instead of the buy button you intended. Google has published research tying these metrics to conversion behavior, and our own data across 300+ brands running Nostra AI shows measurable revenue lift, roughly 3% on average, once these scores move into the "Good" range. Treating a core web vitals issue as a technical afterthought ignores the direct line between page experience and checkout completion, which is exactly why the next step is figuring out precisely which metric is dragging you down before you touch a single line of code.
Before you touch a single template, find out exactly which metric is dragging your Core Web Vitals assessment failed result down, and on which pages. Guessing wastes engineering time on the wrong fix. Start in Search Console's Core Web Vitals report, which groups URLs by status (Good, Needs Improvement, Poor) and metric, so you can see immediately whether LCP, INP, or CLS is the culprit and how many URLs are affected.
Google Search Console and the Chrome User Experience Report (CrUX) show what real shoppers actually experienced over the last 28 days, which is the data Google uses to pass or fail your site. Export the failing URL groups and look for patterns: are they all product pages, all collection pages, or scattered across templates? That pattern usually points straight to the root cause, whether it's a shared carousel component or a single heavy hero image used site-wide.
Field data tells you what shoppers actually experienced. Lab data tells you why.
Once you know which metric and template are failing, run PageSpeed Insights or Chrome DevTools' Lighthouse panel on a representative URL from that group. Lab data breaks the metric into its components: for LCP you'll see the exact element that's slow and the time spent on each phase (TTFB, load delay, load time, render delay). For CLS, DevTools highlights the specific element that shifted and by how much. This is where a broad core web vitals issue becomes a specific, fixable line item.
Mobile and desktop scores diverge often on ecommerce sites, since mobile carries slower CPUs and networks plus the same heavy images, which is a big part of why mobile lags behind desktop on conversions. Build a simple diagnostic checklist before moving to fixes:
Answering these four questions tells you exactly which fix to apply next, and to which pages, instead of applying a blanket change and hoping it works.
Once you've confirmed LCP is the metric dragging down your score, focus on the render path for whatever element is loading slowest, usually a hero image, product photo, or above-the-fold banner (our full guide to improving Largest Contentful Paint goes deeper on each phase). Fixing LCP almost always comes down to four levers: server response time, render-blocking resources, resource load time, and how quickly the browser discovers the image at all.

Big, uncompressed product images are the single most common cause of slow LCP on ecommerce storefronts. Serve images in modern formats like WebP or AVIF, size them to the actual display dimensions instead of shipping a 4000px master file, and add fetchpriority="high" to your LCP image so the browser fetches it before less important assets. Never lazy-load the LCP element itself, that delays discovery and makes the metric worse, not better.
<img src="hero-product.webp" fetchpriority="high" width="800" height="600" alt="Product hero">
Inline critical CSS for above-the-fold content and defer everything else. Move non-essential scripts (chat widgets, review plugins, tracking pixels) to load after the main content paints, using defer or async attributes. On many storefronts, a single blocking script from a third-party app is the entire reason LCP crosses 4 seconds.
If the browser can't paint your hero image until it finishes downloading five other scripts, your LCP score was never going to pass.
A slow Time to First Byte (TTFB) pushes every downstream metric back, since nothing can render until the HTML arrives, which is exactly why TTFB matters and how to improve it. Common culprits on ecommerce platforms include unoptimized app integrations, slow third-party APIs called server-side, and CDN configurations that don't cache HTML aggressively enough. Google's own guidance on optimizing LCP breaks down the four sub-parts of the metric if you want to see exactly where the time is going on a specific URL.
Handling all of this manually means touching your theme code, your CDN rules, and your app integrations separately, then testing each change against real traffic. This is exactly the gap our edge delivery speed agent closes: it sits at the edge, automatically compresses and reprioritizes images, defers non-critical scripts, and caches HTML at the edge without you rewriting a single template. Brands running Dash have seen LCP improvements that translate into page loads up to 47% faster, without a developer touching the codebase.
INP replaced First Input Delay as the responsiveness metric in March 2024, and it's stricter because it measures every interaction on the page, not just the first one. When a shopper taps "Add to Cart" or opens a size dropdown and the page takes over 200ms to respond, that click counts against your score. On ecommerce storefronts, the usual suspects are heavy JavaScript execution on the main thread, third-party scripts that hijack event listeners, and large DOM trees that slow down every re-render.
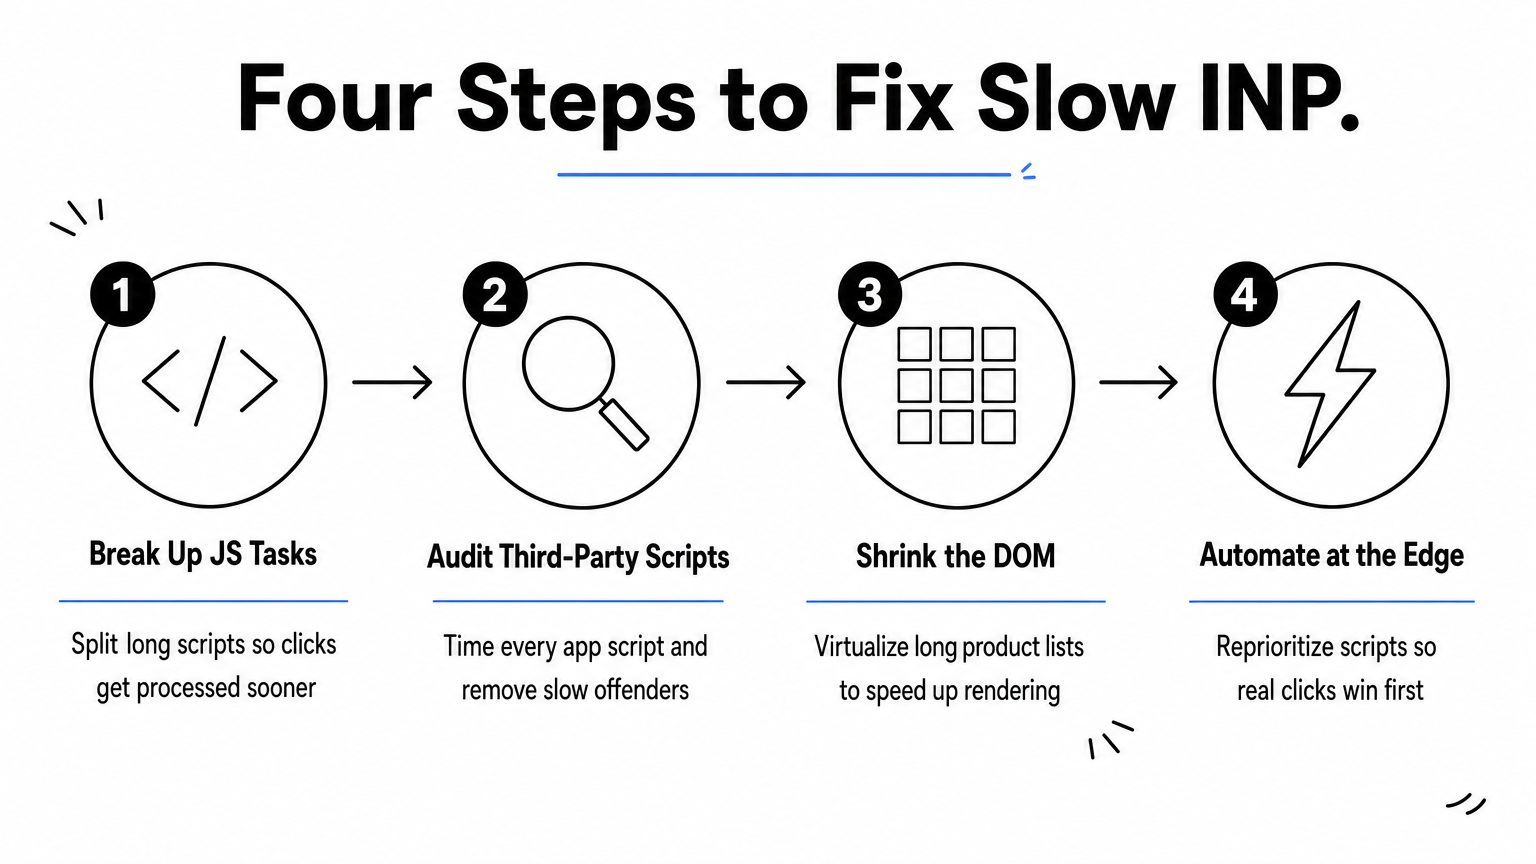
Open Chrome DevTools' Performance panel and look for long tasks, any block of JavaScript that runs uninterrupted for more than 50ms blocks the main thread from responding to clicks, and cleaning out the scripts you no longer use is the fastest way to shrink that work. Splitting large scripts into smaller chunks using setTimeout or the scheduler.yield() API lets the browser process user input between chunks instead of making shoppers wait. This matters most on product listing pages where filtering, sorting, and quick-view modals all fire JavaScript on click.
If a shopper's click has to wait behind a 300ms JavaScript task, no amount of server speed fixes that interaction.
Apps for reviews, upsells, live chat, and personalization each add their own event listeners and often run unrelated code on every click, not just clicks meant for them. Pull a list of every third-party script running on your storefront and time how long each one takes to execute using the Performance panel's "Bottom-Up" view. Removing or deferring even one poorly-coded app can cut INP dramatically, since app bloat from third-party scripts is the single most common cause of failed INP on Shopify and Magento stores we've audited.
A bloated DOM, common on category pages with hundreds of product cards rendered at once, makes every style recalculation and layout pass slower, which drags out the time between a click and the next visual update. Virtualizing long lists so only visible products render, and debouncing event handlers on search-as-you-type or filter interactions, both cut down the work the browser does per interaction.
Manually auditing every app and script on your storefront takes real engineering hours, and new apps get added faster than most teams can re-audit them. Knox and Dash together handle much of this automatically: blocking bot-driven interactions that quietly hurt speed and conversions and inflate INP data, and reprioritizing script execution at the edge so real shopper clicks get processed first, without you rewriting your theme's JavaScript.
CLS problems show up as visible jumps: a banner loads late and pushes the buy button down just as a shopper taps, or a font swap resizes text and shifts everything below it. Unlike LCP or INP, layout shift is almost always caused by missing dimensions or content injected without reserved space, which makes it one of the more mechanical fixes once you find the offending element in DevTools.

Every image, embed, and ad slot needs explicit width and height attributes or a CSS aspect-ratio so the browser reserves space before the asset arrives. This is the single highest-impact fix for ecommerce layout shift, since product grids and hero banners are usually the worst offenders.
.product-image {
  aspect-ratio: 4 / 5;
  width: 100%;
  height: auto;
}
A layout shift almost always means the browser didn't know how much space an element needed until it was too late to reserve it.
Custom fonts that swap in after the page renders can reflow entire paragraphs and push buttons out from under a shopper's cursor. Set font-display: optional or preload your primary font file so the browser either waits briefly or skips the swap entirely. Sizing your fallback font to closely match your custom font's metrics also reduces the visible jump when the swap does happen.
Dynamically injected banners, cookie notices, and promotional bars are frequent culprits because they load after the initial render and push everything below them down the page. Reserve a fixed-height container for any element that loads asynchronously above the fold, and avoid injecting new content above existing content unless the user triggered it, like expanding a dropdown.
Chrome DevTools' Performance panel highlights exactly which element caused each shift and by how much, so you don't have to guess. Google's documentation on optimizing CLS covers the underlying scoring formula if you want the full technical breakdown. On storefronts running Dash, layout-shifting elements like lazy-loaded images and third-party embeds get space reserved automatically at the edge, which is why brands using it rarely see CLS as their failing metric once the observation window ends.
Once you've shipped fixes for LCP, INP, or CLS, resist the urge to declare victory after one clean PageSpeed Insights run. Lab data confirms the fix works in a controlled test, but it takes real traffic over time before you know if your core web vitals assessment failed result actually flips to passing. Treat this step as confirmation, not celebration.
Start by re-testing the exact URLs that failed, on both mobile and desktop, using Lighthouse or PageSpeed Insights, keeping in mind what Lighthouse scores do and don't mean for SEO. Confirm the specific metric that failed now scores in the "Good" range in the lab. If it doesn't, you haven't found the real bottleneck yet, go back to DevTools' Performance panel and check for a second, less obvious culprit like a lazy-loaded ad slot or a newly added app script.
Field data updates on a rolling basis, so Search Console won't reflect your fix immediately. Check the Core Web Vitals report weekly and track whether affected URLs move from "Poor" toward "Needs Improvement" and eventually "Good."
A fix isn't real until field data confirms it, lab scores only tell you it's possible.
Build a short verification checklist so nothing slips through:
A single core web vitals issue rarely stays fixed on its own. New apps, theme updates, and marketing scripts get added constantly on ecommerce storefronts, and any one of them can reintroduce a slow LCP or a layout shift you already solved. Set a recurring calendar reminder, monthly at minimum, to run a Shopify speed test, re-check Search Console, and re-audit third-party scripts.
This is where continuous, automated monitoring beats manual spot-checks. Nostra AI's agents watch every deploy and every new script in real time, so a fix doesn't quietly break the next time someone installs a review widget or swaps a hero banner. Instead of re-running Lighthouse after every storefront change, the agents flag regressions before they show up in Search Console.
A Core Web Vitals assessment failed result isn't a life sentence. It's a diagnostic pointing you toward specific, fixable problems: a slow hero image, a bloated third-party script, a banner that shifts your buy button. Work through the metrics in order, LCP, INP, then CLS, and verify each fix against real field data before moving on. The teams that stay passing don't run Lighthouse once a quarter and hope. They treat performance as an ongoing discipline, because every new app install or theme tweak can quietly reintroduce the same core web vitals issue you just solved.
Manually re-auditing your storefront after every change doesn't scale, especially as your app stack grows. That's the exact problem our agents were built to solve, catching regressions before they reach Search Console instead of after. If you'd rather have speed, bot protection, and QA testing running automatically at the edge, see how Nostra's agents run your store.


.svg)
