Your email marketing ecommerce conversion rate is the share of email recipients who place an order after you send them a message. Published benchmarks for orders per delivered email mostly fall between about 0.2% and 3%, and automated flows such as welcome and post-purchase emails run well above that. What counts as good depends on how you define a conversion, which email type you send, and your industry.
This guide shows you how to calculate the metric, which denominator to use, and what benchmarks look like by email type and by industry. You will also see why your number can look worse than it really is, and which changes move it fastest.
At Nostra AI, we work with more than 300 ecommerce brands on what happens to traffic once it reaches the storefront. Email conversion rate is where that work shows up clearly, because bots, slow pages, and expired cookies all distort the figure before you ever judge a campaign.
Your email conversion rate matters because it is the one core email metric that measures orders instead of attention. Opens and clicks tell you people noticed a message. Conversion rate tells you whether the message made money.
Every email costs something, even if the cost is only list fatigue. The conversion rate shows what you get back. Multiply it by your average order value and you get revenue per delivered email, a figure that lets you compare a welcome flow, a flash sale, and a weekly newsletter on one scale. Email is also an owned channel. You do not pay per click as you do on paid search or social, so every gain in conversion rate carries into all future sends.
Growth and ecommerce leaders also use the metric to decide where effort goes. If your abandoned cart flow converts at several times the rate of your weekly campaign, you know where the next hour of work belongs.
Open rate measures attention. Conversion rate measures revenue.
Open rate has been unreliable since Apple Mail Privacy Protection arrived in 2021, because it preloads images and registers opens that no person made. Click rate is better, but it still stops at the inbox door. An email with a 5% click rate can produce zero orders if the landing page is slow, the offer does not match the email, or the clicks came from bots. Conversion rate catches all three failures, which is why it sits at the end of your email funnel.
Track it by email type, not as one blended number. A blended figure hides the fact that your flows may be carrying your campaigns.
Small gains add up quickly. Say you send 8 campaigns a month, each to 100,000 delivered recipients, and your average order value is $85. That is 800,000 delivered emails a month. The table shows what a five-hundredths-of-a-point lift does.
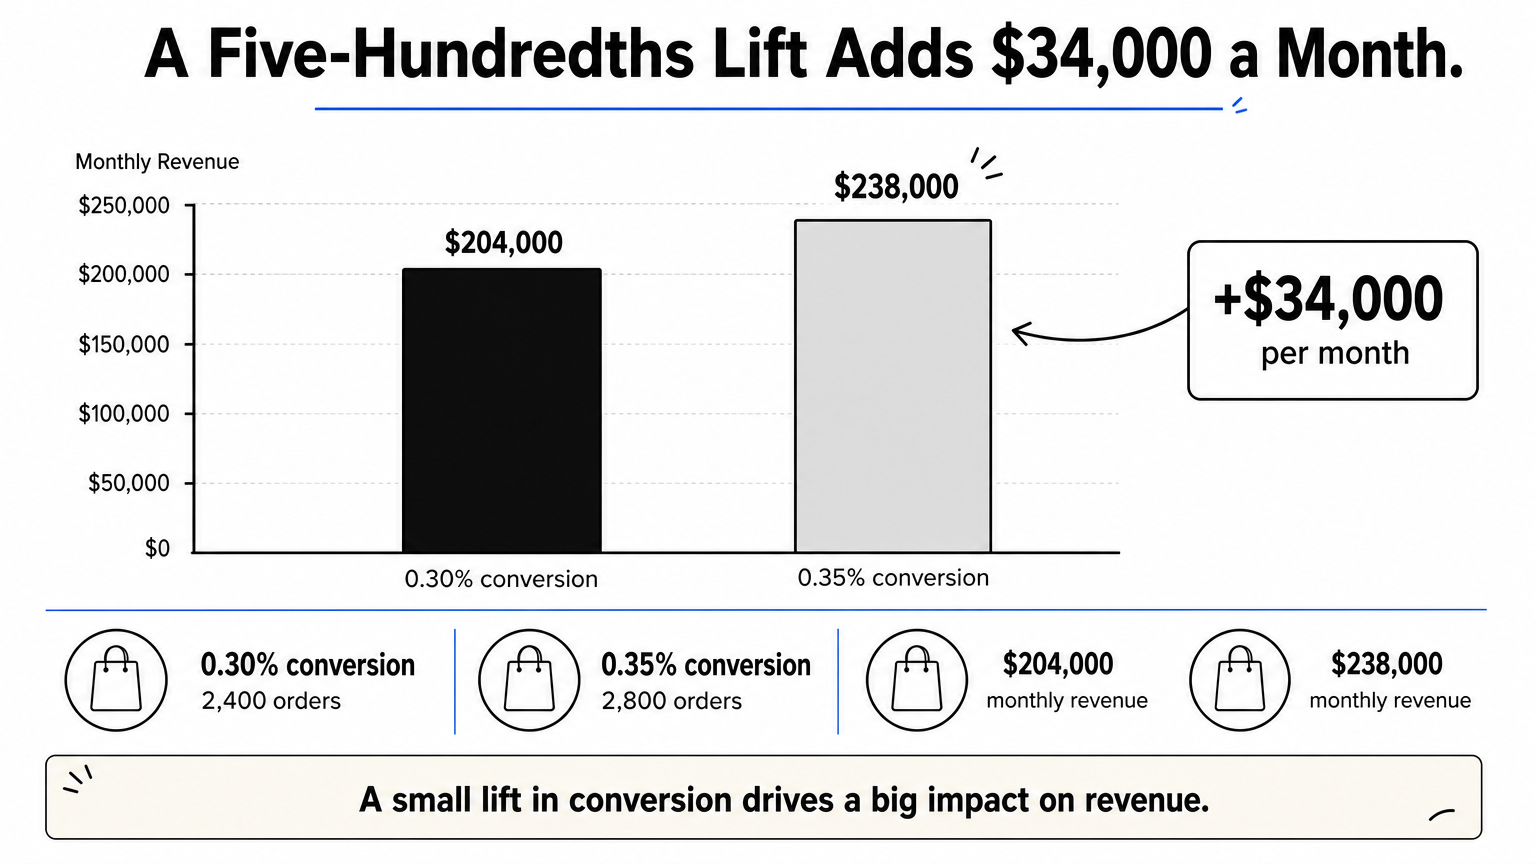
| Conversion rate | Orders per month | Monthly revenue |
|---|---|---|
| 0.30% | 2,400 | $204,000 |
| 0.35% | 2,800 | $238,000 |
| Difference | +400 | +$34,000 |
That is $34,000 more a month with no extra sends and no extra ad spend. It is also why a metric that looks tiny on a dashboard deserves a weekly check.
Divide the number of orders attributed to an email by the number of emails delivered, then multiply by 100. Delivered is the right base for your email marketing ecommerce conversion rate because bounced emails never had a chance to convert. Sent counts overstate your audience and make every campaign look weaker than it is.
Email conversion rate = (orders from the email ÷ delivered emails) × 100
Here is a campaign worked through. You send to 20,400 addresses, and 400 bounce, so 20,000 are delivered. Of those, 800 recipients click and 60 place an order. Your average order value is $85, so the campaign brought in $5,100.
All three are correct. They answer different questions, which is the reason published benchmarks seem to contradict each other.
Pick the base that fits the decision you are making. Use delivered emails when you benchmark against others or compare campaigns. Use clicks when you want to judge the landing page, the offer, or site speed, because everything before the click is already out of the picture.
| Base | Formula | Best for | Watch out for |
|---|---|---|---|
| Delivered emails | Orders ÷ delivered | Benchmarking, comparing campaigns | Poor list quality drags it down |
| Clicks | Orders ÷ clicks | Diagnosing the landing page and site | Bot clicks inflate the base |
| Opens | Orders ÷ opens | Rarely useful | Privacy features inflate opens |
Divide by delivered emails to benchmark, and divide by clicks to diagnose.
Tag every email link with UTM parameters so GA4 can group sessions and orders by campaign. Use a consistent naming scheme, or your reports will fragment into dozens of near-duplicate rows. Here is a pattern you can copy.
https://www.yourstore.com/products/serum?utm_source=klaviyo&utm_medium=email&utm_campaign=fall-launch&utm_content=hero-cta
Your email platform and GA4 will report different order counts. Each uses its own attribution window and its own rules for crediting a sale. Choose one source of truth, keep its window fixed, and compare trends inside that source. Changing the window mid-year breaks every comparison you made before it.
A good ecommerce email conversion rate is roughly 0.2% to 3% of delivered emails for broadcast campaigns, depending on industry, with automated flows landing several times higher. You will also see 2% to 5% quoted everywhere. That range is a general ecommerce conversion rate guideline that often gets applied to email without naming the base, so a store at 0.4% on campaigns is not necessarily failing.
Triggered emails beat broadcasts because they reach someone at the moment of intent. The figures below come from published benchmarks, and they vary by dataset and by how each source defines a conversion.
| Email type | Published benchmark | How to read it |
|---|---|---|
| Broadcast campaigns | About 0.3% in one large platform's data, 1% to 5% in others | The gap comes from definitions and bases |
| Automated flows overall | About 0.4% in the same platform data | Flows edge out campaigns even on a blended view |
| Welcome series | About 3% | New subscribers are the most receptive |
| Post-purchase follow-up | About 6.8% | Customers already trust you |
| Abandoned cart | Recovers 10% to 15% of abandoned purchases | A recovery rate, not a per-email rate |
Do not compare the abandoned cart row to the others. Recovery rate asks how many lost carts came back. Conversion rate asks how many recipients bought.
Purchase frequency and order value shape the spread. These figures are published email-to-order rates for ecommerce verticals.
| Industry | Orders per delivered email |
|---|---|
| Grocery | 7.9% |
| Furniture and home goods | 3.03% |
| Pets | 2.77% |
| Retail | 2.25% |
| Beauty | 1.92% |
| Fashion | 1.4% |
| Food and beverage | 0.19% |
| Outdoor equipment and sports | 0.06% |
Treat the extremes with caution. Grocery buyers reorder constantly, which lifts the rate. The very low figures likely reflect seasonal or considered purchases and differences in how each brand measures. Use the table as a band, not a target.
It depends on the base. At 2.5% of delivered emails, a broadcast campaign is strong in almost every vertical except grocery. At 2.5% of clicks, you are roughly at the site-wide average that ecommerce stores commonly see, around 2% to 3%, and email visitors usually convert better than that. A rate that low per click points to a landing page, offer, or traffic quality problem.
A good rate is one that beats your own trailing 90 days for the same email type.
Your own history is the most reliable benchmark. It shares your audience, your products, and your measurement setup, which no industry table can match.
Your email marketing ecommerce conversion rate can miss the benchmarks for reasons that have nothing to do with your emails. Measurement gaps, non-human clicks, and slow pages all pull the number down or make it unreliable. Fix those before you rewrite a single subject line.
A subscriber clicks your email on Monday and buys on Friday after comparing options. If the browser has already dropped the tracking cookie, the order shows up as direct traffic and your email gets no credit. Safari limits the lifetime of cookies set by scripts, in some cases to seven days or less, so the gap hits longer consideration cycles hardest. The result is an email conversion rate that understates what email really drives.
Nostra AI's Crumble agent targets this problem. It extends tracking identity from about one week to over two years and recovers lost identities, so platforms like Meta, Google, and Klaviyo can tie later purchases back to the right person.
Security scanners and bots open and click links in emails before any human does. They inflate your click count, which drags down orders per click, and they push sessions into your analytics that will never buy. Apple's privacy preloading adds phantom opens on top. If your click rate jumps while orders stay flat, suspect non-human traffic and look for the tell-tale signs of bot activity before you celebrate.
Blocking bad bots at the edge keeps them out of your sessions, your analytics, and your retargeting audiences. Nostra AI's Edge Protect agent, Knox, filters malicious bot traffic before it reaches the storefront. That gives you cleaner click-to-order figures, which is what you need to judge a campaign honestly.
Email shoppers arrive on mobile, often on a cellular connection, and they leave fast if the page lags. Every second of delay turns some of your paid-for clicks into abandoned sessions. Across its customer base, Nostra AI's Dash agent has delivered up to 47% faster load times and an expected revenue lift of roughly 3%. Speed does not change your email, but load time affects how many clicks turn into orders.
Before you blame the email, check whether the click ever became a real visit.
The fastest ways to raise your email marketing ecommerce conversion rate are to move volume into triggered flows, target by behavior, and fix what happens after the click. Subject line tweaks come last, because they influence opens, and opens do not pay you.
Flows convert better because they fire on intent. Build these four first, and give each one a clear owner.
Review each flow quarterly. Flows decay quietly, with stale offers, broken product links, and out-of-stock items all costing you orders with no alert.
Segment by what people did, not who they are. Purchase history, browsing activity, and recent engagement predict orders better than age or location. A customer who bought a cleanser last month should get a personalized serum email, not a generic sale blast.
Then make the click land where the email promised, which is the heart of landing page optimization. Link to the featured product or collection, not the homepage. Show the same offer and the same imagery above the fold. Message match is one of the cheapest fixes available, and it shows up directly in your orders-per-click figure.
Change a single element per A/B test: the offer, the hero product, the call to action, or the send time. Judge winners on orders per delivered email or revenue per recipient, never on opens. Let each variant collect a meaningful number of orders, not just clicks, before you declare a result. A test that ends after a handful of purchases tells you about luck.
People use the 80/20 rule in email in two ways. The first says roughly 20% of your flows, segments, or campaigns produce most of your revenue. It is a common pattern, not a law, so pull revenue by flow and segment and see what your data says. The second says keep about 80% of your content useful and 20% promotional, which protects the list from fatigue.
Use the first version to decide where to focus. If two flows drive most of your email revenue, improve those before you build a fifth.
Fix the flows and the landing page before you rewrite another subject line.
Your email conversion rate is orders divided by delivered emails, benchmarked by email type and industry, and diagnosed by orders per click. Published figures run from under 1% for broadcasts to several percent for flows, so use them as a band. Your own trailing 90 days is the target that matters, and clean measurement is what makes it trustworthy.
If bot traffic is muddying your click data and your campaign reports, start there. See how Edge Protect blocks malicious bots before they reach your storefront, so your email numbers reflect real shoppers.


