The conversion rate ecommerce definition comes down to one line: it is the percentage of store visits that end in a purchase. If 100 sessions produce 2 orders, your ecommerce conversion rate is 2%. Google Analytics frames it the same way, as the ratio of transactions to sessions, and most online stores land somewhere between 1% and 3%.
Some teams stretch the term to cover any desired action, such as an email signup or an add to cart. Those actions matter, but they are better called micro-conversions. This article covers why the rate matters, how to calculate it without skewing it, what counts as a good number, and how to raise it.
We build AI agents that run at the edge of ecommerce storefronts, so we spend our days on the problems that quietly drag this number down: slow pages, bot traffic that inflates sessions, and broken checkout steps. That hands-on view shapes the advice below.
Ecommerce conversion rate matters because it is the one number that links your traffic to your revenue. Every visit costs you something, whether in ad spend, content work or discounts. The rate tells you how much of that cost turns into orders.
Take a store with 40,000 monthly sessions, a 2.0% conversion rate and a $90 average order value. That is 800 orders and $72,000. Lift the rate to 2.5% on the same traffic and the picture changes.

| Scenario | Sessions | Conversion rate | Orders | Revenue at $90 AOV |
|---|---|---|---|---|
| Current | 40,000 | 2.0% | 800 | $72,000 |
| After a 0.5 point lift | 40,000 | 2.5% | 1,000 | $90,000 |
That half point adds $18,000 a month without a single extra click. To earn the same $18,000 by buying traffic at a 2% rate, you would need 10,000 more sessions, a 25% increase in volume.
A half-point gain in conversion rate is worth the same as 25% more traffic, and it costs nothing per visit.
A blended rate is a starting point, not a verdict. Split it by device, channel and landing page and it becomes a diagnostic tool. A healthy desktop rate next to a weak mobile rate points to a mobile problem, such as slow loads or a clumsy checkout, not a demand problem.
The rate also keeps your marketing honest. A campaign that sends plenty of clicks but converts far below your site average is bringing the wrong shoppers, or sending them to the wrong page. Without the rate, you only see the spend.
You calculate ecommerce conversion rate by dividing orders by sessions and multiplying by 100. The math is easy. The hard part is choosing a consistent denominator and making sure the sessions you count are real shoppers.
conversion rate = (orders ÷ sessions) × 100
With 800 orders from 40,000 sessions, that is 800 ÷ 40,000 × 100 = 2.0%. Use the same time window for both numbers, and use at least a few full weeks so weekday and weekend patterns balance out.
The denominator is where teams disagree. Dividing by sessions is the Google Analytics convention. Dividing by unique users gives a higher figure, because one person can visit several times. GA4 reports both a session-based and a user-based rate. Pick one and stay with it, or your trend lines will mislead you.
For the headline number, a conversion is a completed purchase. Everything else is a supporting metric that shows where shoppers drop off.
| Metric | Formula | What it tells you |
|---|---|---|
| Purchase conversion rate | Orders ÷ sessions | Overall store performance |
| Add-to-cart rate | Sessions with an add to cart ÷ sessions | Product page appeal |
| Checkout completion rate | Orders ÷ checkout starts | Checkout friction |
Newsletter signups, wishlist adds and account registrations are real goals too. Track them separately so they do not blur the purchase rate.
Your rate is only as accurate as your session count. Automated traffic inflates sessions and pushes the rate down. Suppose 6,000 of those 40,000 sessions are bots. Real sessions are 34,000, and the true rate is 800 ÷ 34,000 × 100 = 2.35%, not 2.0%.
That gap sends teams chasing fixes for a problem that is partly a measurement error. It also wastes ad spend, since bots click ads and never buy. Blocking malicious bots before they reach analytics, which is what our Knox agent does at the edge while letting verified crawlers like Googlebot through, keeps the denominator honest.
A conversion rate calculated on bot-inflated sessions understates how well your store really converts.
A good ecommerce conversion rate for most stores sits between 1% and 3%, and anything above 3% is strong. Published sources vary, and some stretch the typical range to 4%. Treat any benchmark as a rough reference, because your own context moves the number a lot.
| Reference point | Commonly cited figure | Note |
|---|---|---|
| Typical online store | 1% to 3% | Some sources say up to 4% |
| Desktop | About 4% | Commonly cited US figure |
| Mobile | About 1.5% | Commonly cited US figure |
| High-intent search traffic | Above your site average | Shoppers arrive ready to buy |
| Social and display traffic | Below your site average | Shoppers are browsing, not buying |

Mobile converts less than desktop in most published data, even though mobile often brings more visits. That gap is where many stores find their easiest gains.
A store selling $20 accessories will convert differently from one selling $900 watches. Price and consideration time shape the rate more than any tactic. Traffic mix, the share of returning customers, seasonality and promotions all move it too.
As a working rule, investigate when you sit below 1%, treat 1% to 3% as normal territory, and look for what is working when you pass 3%. Then set your own baseline. Track the trailing 90 days by device and channel, and measure success against that baseline, not against a stranger's average.
The best benchmark for your store is your own trend, segmented by device and channel.
You improve ecommerce conversion rate by fixing what stops real shoppers in a set order: clean data first, then page speed, then checkout, then controlled tests. Skipping to design experiments before fixing the basics wastes testing time.
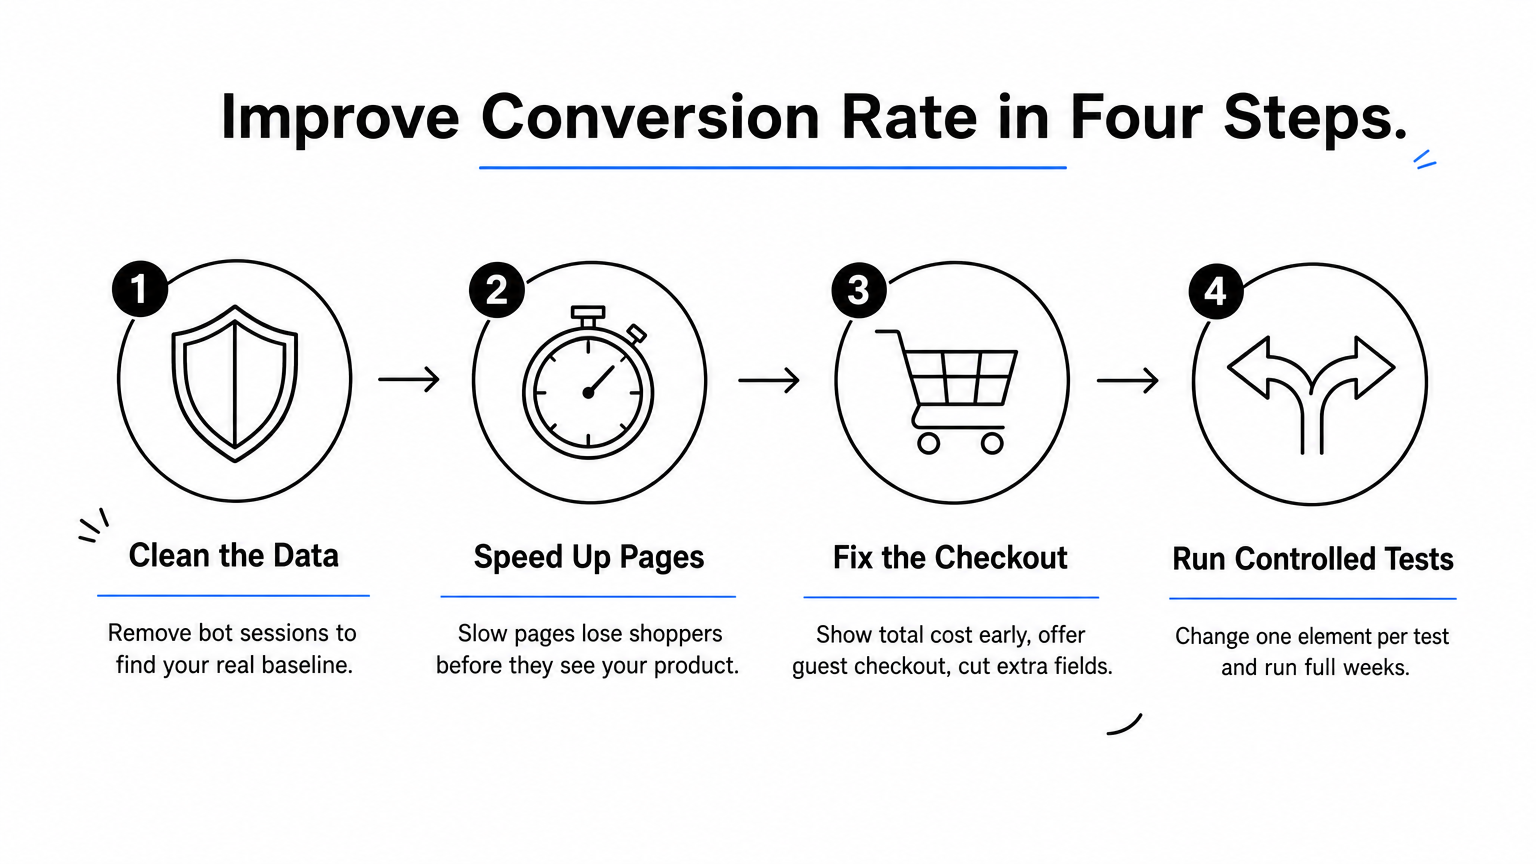
Start by removing bot sessions so you know your real baseline. Then look at speed. A slow page loses shoppers before they see your product, and the damage is invisible in most reports because those visits simply bounce.
Our Dash agent monitors site speed around the clock and accelerates pages at the edge. Across the brands we work with, it has delivered up to 47% faster load times and an expected revenue lift of about 3%. Results depend on your store, and full acceleration typically takes about two weeks.
Most lost orders happen late. Extra costs that appear at checkout, forced account creation and long forms are common reasons shoppers abandon. Show the total cost early, offer guest checkout and cut every field you do not need.
Also check that the path works. A broken promo field or a button that fails on one browser kills conversions silently. Our Patch agent walks the journey from homepage to checkout on real desktop and mobile devices, in Chrome and Safari, and files bug reports with reproduction steps and video. A manual checkout test every week gets you part of the way.
The 80/20 rule, or Pareto principle, says roughly 80% of results come from 20% of causes. In ecommerce, a small share of products, landing pages and customer segments usually drives most of your revenue. It is a rule of thumb, not an exact law.
Point your testing there first. A lift on your top five landing pages beats polishing a page nobody visits. Change one element per A/B test, run it for full weeks, and wait for enough orders before you call a winner.
Fix the biggest leaks on your highest-traffic pages first, and test one change at a time.
Your ecommerce conversion rate is orders divided by sessions, times 100. It matters because it converts traffic into revenue, and it is only useful when the sessions behind it are real. Most stores land between 1% and 3%, but your own trend by device and channel is the benchmark that counts.
Start with clean measurement, then move through speed, checkout and testing. Each step compounds the one before it.
If bot traffic is inflating your sessions and wasting ad spend, that is the first leak to close. You can see how Edge Protect filters bad bots before they reach your store and gives you a conversion rate you can trust.


