You want a straight answer: what's the conversion rate ecommerce formula, and what should your number actually look like? It's simpler than most dashboards make it seem, but the way you calculate it and the traffic you calculate it on can throw the whole metric off.
Here's the direct answer: divide total orders by total sessions, multiply by 100, and you get your conversion rate. That's the ecommerce conversion rate formula in full. The harder part is interpretation. A 2% conversion rate might be strong for one category and weak for another, and if bot traffic is inflating your session count, your real rate could be much higher than what Google Analytics reports.
This article walks through how to calculate ecommerce conversion rate correctly, what counts as a good benchmark by industry, and the variables (speed, bot traffic, checkout friction) that quietly drag your percentage down. We'll also cover practical ways to increase your ecommerce conversion rate, because knowing the number matters less than knowing what's skewing it and what to fix first.
Most dashboards throw dozens of metrics at you, but conversion rate is the one that tells you whether your traffic is actually turning into money. You can have record-breaking sessions from a viral TikTok post or a big ad push, but if none of those visitors buy, that traffic is just noise. Conversion rate strips away vanity numbers and forces you to answer the only question that matters to your P&L: out of everyone who showed up, how many paid you?

A conversion rate is the only metric that turns raw traffic into a revenue forecast you can actually trust.
Because conversion rate multiplies against every session, tiny movements compound fast at scale. A store running 100,000 monthly sessions at a $75 average order value doesn't need a redesign to add six figures in annual revenue, it just needs a fraction of a percentage point.
| Monthly Sessions | Conversion Rate | Orders | Monthly Revenue (at $75 AOV) |
|---|---|---|---|
| 100,000 | 1.5% | 1,500 | $112,500 |
| 100,000 | 2.0% | 2,000 | $150,000 |
| 100,000 | 2.5% | 2,500 | $187,500 |
That half-point jump from 2.0% to 2.5% is worth $37,500 a month, or $450,000 a year, without spending another dollar on ads. This is why teams obsessed with customer acquisition cost in a cookieless world eventually shift their attention to conversion rate optimization instead. Getting more people to your site is expensive. Getting more of the people already there to check out is usually cheaper and faster.
Conversion rate also works as a diagnostic tool, not just a scoreboard. A sudden drop usually means something broke, whether that's a slow-loading product page, a checkout error, or a spike in bot traffic inflating your session count while contributing zero purchases. Bots are a bigger problem than most teams realize. If a botnet is hammering your site with fake sessions, your denominator grows while your numerator stays flat, and your real conversion rate looks worse than it actually is. Tools built to catch and block this traffic before it hits your analytics, like Knox, keep the metric honest so you're reacting to real customer behavior instead of chasing a number that's been quietly distorted.
Finally, conversion rate matters because it's comparable over time and across channels in a way raw order counts aren't. It lets you judge whether a homepage redesign helped or hurt, whether a new checkout flow reduced drop-off, or whether a specific traffic source (organic, paid, email) is sending you buyers or just browsers. Without it, you're optimizing blind.
At its core, the ecommerce conversion rate formula is a single division: total orders divided by total sessions, multiplied by 100 to get a percentage. Sessions, not unique visitors, are the standard denominator because someone can visit twice in a day and convert on the second trip, and you want that behavior reflected. Here's the formula written out plainly:
Conversion Rate (%) = (Total Orders ÷ Total Sessions) × 100
The formula only takes two numbers, but getting clean numbers is where most stores get it wrong.
Say your store logged 40,000 sessions last month and closed 900 orders. Plug those into the formula: 900 divided by 40,000 equals 0.0225, multiply by 100 and you land at a 2.25% conversion rate. That's the number you'd report to your team, and it's the same math whether you're pulling data from Shopify, GA4, or a custom dashboard. The tricky part isn't the arithmetic, it's making sure both numbers actually represent real customer behavior before you trust the result.
Calculating ecommerce conversion rate for your whole site is useful, but segmenting it tells you far more. Break it down by:
A blended site-wide rate can hide a paid campaign that's bleeding money on visitors who never had a chance to convert. If you want to go deeper, some teams also track a revenue-based conversion rate, dividing total revenue by sessions instead of orders, which factors in average order value alongside purchase frequency. Both versions answer the same underlying question: out of everyone who showed up, how many became customers, and how much did they spend when they did.
Most ecommerce sites convert between 1.5% and 3%, according to data regularly cited by Google's own ecommerce benchmarks. But that range hides huge variation by category. A luxury skincare brand selling a $200 serum will naturally convert lower than a snack brand selling a $12 bundle, simply because the purchase decision takes longer and carries more consideration. Treat industry averages as a sanity check on what a good ecommerce conversion rate looks like, not a scoreboard you're graded against.
The only benchmark that matters long-term is your own store's trend line, not someone else's industry average.
Breaking down what is conversion rate in ecommerce by vertical, using conversion rate benchmarks by industry, makes the number far more useful than a single blended figure. Beauty and personal care sites tend to sit higher than furniture or electronics, where price points are steep and buyers research longer before committing. Mobile traffic also converts lower than desktop across almost every category, even though mobile sessions often make up the majority of traffic, and closing that mobile and desktop gap is its own project.
| Category | Typical Conversion Rate |
|---|---|
| Beauty & personal care | 2.5% - 4% |
| Fashion & apparel | 1.5% - 3% |
| Home & furniture | 1% - 2% |
| Electronics | 1% - 2.5% |
| Food & beverage | 3% - 5% |
Comparing yourself against a competitor's published rate rarely helps, because you rarely know how they're calculating it or whether bot traffic is inflating their sessions the same way it might be inflating yours. Focus instead on your store's rate over the last 6 to 12 months, segmented by device and channel, and use that as your real benchmark. If you're climbing quarter over quarter, you're doing the work right, regardless of what the industry average says you should hit.
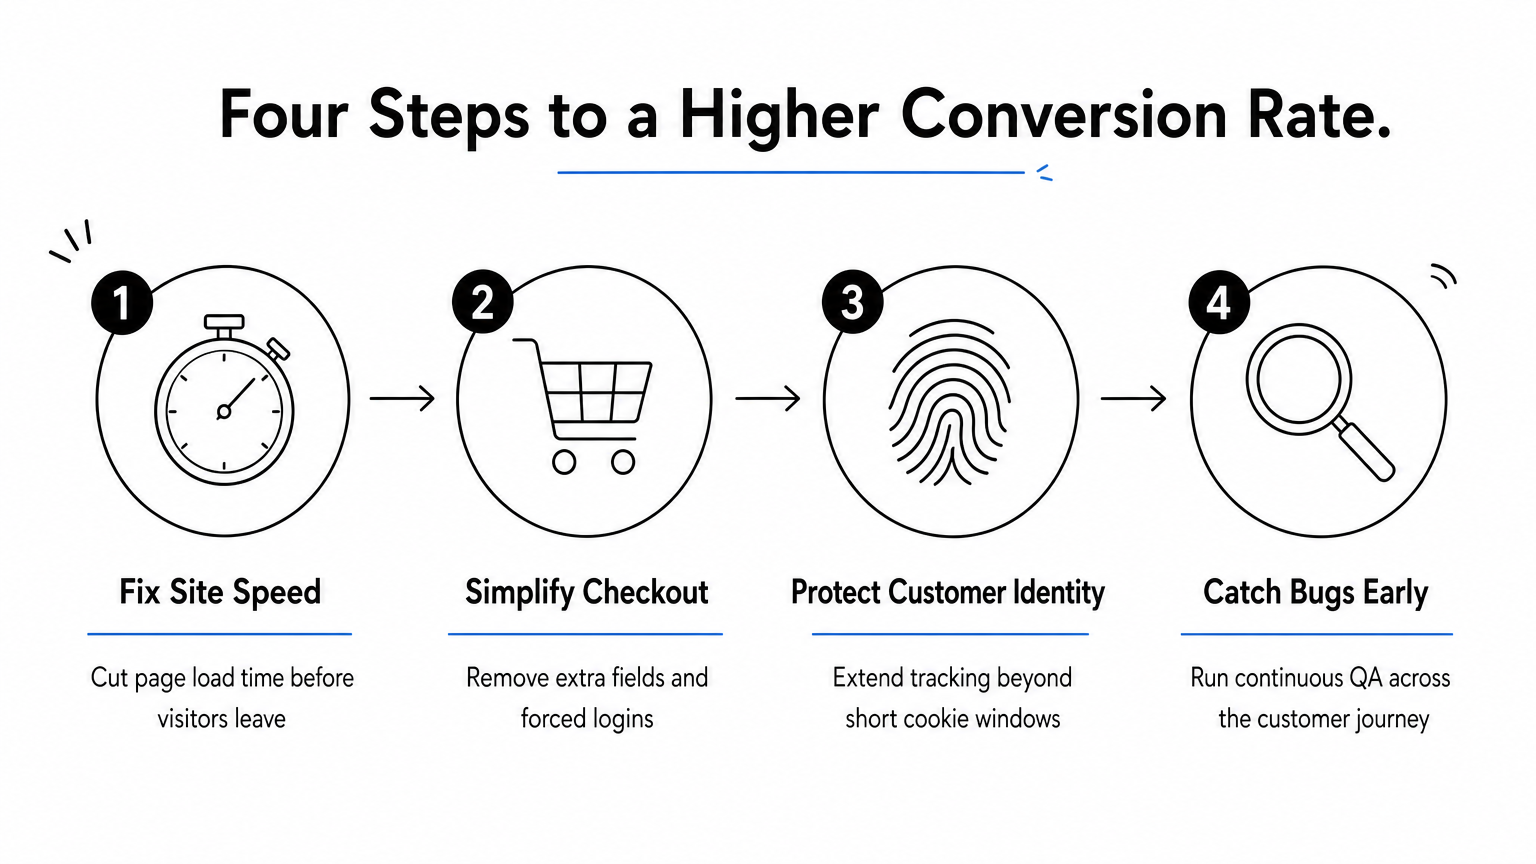
Start with the thing that touches every single visitor: page load time. Site speed has a direct, measurable relationship between page speed and sales, and it's usually the cheapest problem to fix relative to its payoff. A one-second delay on a product page can quietly cost you a chunk of mobile shoppers who never wait to see the add-to-cart button. Agents like Dash sit at the edge of your storefront and shave load times without touching your codebase, which matters if your dev team is already booked on other priorities.
Speed isn't a nice-to-have metric, it's the first filter every visitor applies before they even consider buying.
Next, look at why shoppers abandon their carts. Checkout is where good intent goes to die if the process asks for too much too soon. Common friction points worth auditing:
Once you strip these out, you're not persuading anyone to buy, you're just getting out of their way.
Protecting the data you already have matters as much as acquiring new visitors. Browser privacy changes and the disappearance of third-party cookies cut typical cookie lifespans down to about a week, which breaks retargeting and skews your reported conversion rate because returning buyers look like brand-new sessions. Tools like Crumble extend that identity window to two years or more, so your Meta and Klaviyo campaigns actually reach the people who already showed interest.
Finally, broken checkout flows and JavaScript errors quietly tank conversion rate without ever showing up as an obvious outage. Running continuous QA across the full customer journey, the way Patch does with real devices, catches these issues before they cost you a week of lost orders.
Before you trust any conversion rate number, check what's actually feeding into it. Most stores don't have a strategy problem, they have a data quality problem, and the fixes below cost nothing but attention. Get these wrong and every optimization decision downstream is built on a bad number.
This is the biggest and most common skew. Scrapers, credential-stuffing bots, and AI crawlers hit your storefront constantly, and most analytics platforms count every one of those hits as a session, because GA4 only filters the bots that declare themselves. Run the standard conversion rate formula ecommerce teams use, orders over sessions, and a flood of bot traffic quietly drags your denominator up while your numerator sits still. Your reported rate looks worse than reality, and it can push teams into panic-mode redesigns that were never needed. If you want to check whether your sessions are bots or real shoppers, agents like Sherlock identify and separate that non-human traffic before it pollutes your reporting.
If bots are in your session count, your conversion rate isn't measuring customers, it's measuring noise.
Platform mismatches cause more confusion than most teams admit. Shopify might count a session differently than GA4, and if you're mixing timeframes, including cancelled or refunded orders in your numerator while excluding them from a competitor's benchmark, you're comparing two different metrics wearing the same label. Before reporting a number, confirm:
A single blended rate hides where the real problem lives. If mobile is dragging your average down while desktop performs fine, a site-wide fix wastes effort on a channel that was never broken in the first place. Segment first, then act.
The ecommerce conversion rate formula itself takes ten seconds to calculate. Trusting the result takes more work: clean sessions, consistent order counts, and enough segmentation to know whether mobile, checkout, or speed is actually holding you back. Once you know your real number, the next move is obvious. Fix the biggest leak first, whether that's a slow product page, a checkout with too many fields, or a percentage of your traffic that was never human to begin with.
Bots are usually the fastest fix with the biggest payoff, because they inflate your denominator without ever converting. Every fake session drags your reported rate down and makes the rest of your optimization work harder than it needs to be. Clean that up before you touch anything else. See how Edge Protect blocks bad bots before they ever reach your funnel so your conversion rate finally reflects real shoppers, not noise.


.svg)
