.svg)
.svg)
.svg)
.svg)
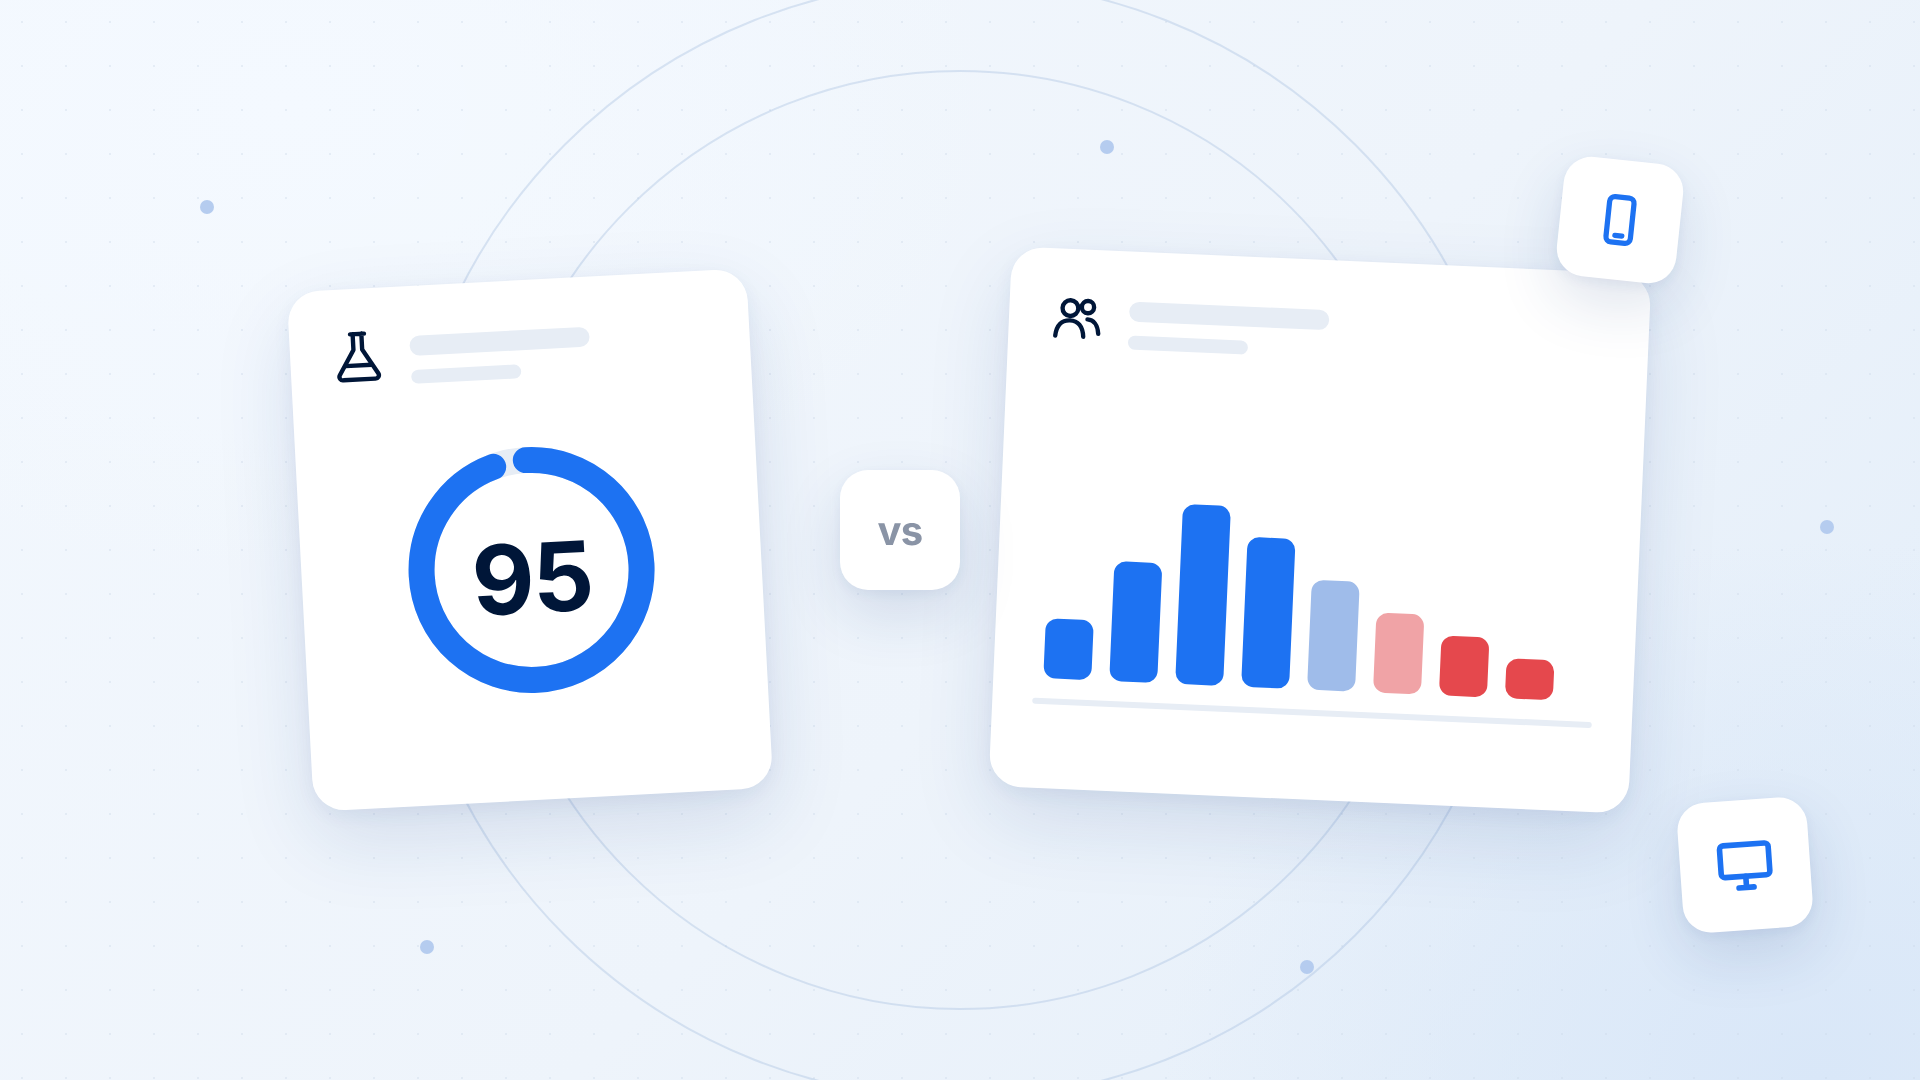
TL;DR: Lab data comes from one simulated test run on a throttled machine. Field data comes from thousands of real visitors on real devices and real networks. The two disagree because they measure different things, and only field data feeds Google's page experience signals. Treat Lighthouse as a debugging tool, not a report card. If your Shopify store shows a 95 in Lighthouse and failing Core Web Vitals in Search Console, believe the field data.
Every performance conversation on an ecommerce team eventually turns into an argument about lab data vs field data. One person runs Lighthouse, gets a 92, and declares the site fast. Another opens Google Search Console, sees a red "Poor" badge on mobile URLs, and declares the site broken. Both are reading real numbers. Neither number is wrong. They are simply answers to two completely different questions, and knowing which question you asked is the difference between fixing your site and burning a sprint on a score that no customer will ever see.
This guide breaks down what each type of measurement actually captures, the specific reasons they drift apart on Shopify stores, which one Google uses when it ranks your collection pages, and how to build a workflow that uses both instead of picking a favorite.
What's in this guide
- What lab data actually measures
- What field data actually measures
- Five reasons your scores disagree
- Which one Google actually uses
- A workflow that uses both
- Fixes that move field data, not just the score
- Frequently asked questions
What lab data actually measures
Lab data, also called synthetic monitoring, is a single page load performed by a machine under conditions you control. Lighthouse, the engine behind Chrome DevTools audits and the score you see in PageSpeed Insights, is the most familiar example. WebPageTest, GTmetrix, Shopify's own speed score, and most uptime tools also produce lab data.
The defining feature of a lab test is that it is deliberately artificial. Lighthouse throttles the CPU to roughly a quarter of your machine's real speed and simulates a slow 4G connection so that results are repeatable across runs. It loads the page cold, with an empty cache, no cookies, no logged in session, and no human being clicking anything. Then it converts the raw timings into a 0 to 100 number using Lighthouse's documented weighted formula, where Largest Contentful Paint, Total Blocking Time, and Cumulative Layout Shift carry most of the weight.
Because the environment is fixed, lab data is excellent at one job: telling you why a page is slow. A synthetic run gives you a full waterfall, a list of render blocking resources, unused JavaScript totals, main thread long tasks, and image sizing warnings. That level of causal detail is impossible to get from real users. Lab data is a microscope.
What lab data cannot do is tell you what your customers experience. One run on one device on one connection at one moment is a sample size of one. Change the location, change the device tier, or run it three more times and the score moves. That volatility is not a bug in the tool. It is the honest consequence of measuring a single event.
What field data actually measures
Field data, also called Real User Monitoring or RUM, is collected from actual visitors as they browse. Chrome quietly reports performance metrics from real Chrome users who have opted in, aggregates them into the Chrome User Experience Report, and Google surfaces that dataset in PageSpeed Insights, the Core Web Vitals report in Search Console, and public tools built on the CrUX API.
Field data has three properties that make it the more commercially meaningful number. It is aggregated across a 28 day rolling window, so it smooths out the noise of any single load. It is reported at the 75th percentile, meaning three out of four of your visitors had an experience at least that good, which forces you to care about your slower quarter rather than your median. And it reflects the messy truth of your actual traffic mix: older Android devices, congested mobile networks, browser extensions, second and third page views with a warm cache, and visitors who scroll and tap while the page is still assembling itself.
The tradeoff is diagnostic depth. Field data tells you that Largest Contentful Paint is 4.1 seconds at the 75th percentile on mobile product pages. It does not hand you a waterfall explaining which script blocked the hero image. Field data is a thermometer, not a microscope.
There is also a coverage limit worth knowing. CrUX only publishes data for URLs and origins with enough traffic to be statistically meaningful, so newer stores and long tail product pages often show origin level data only, or nothing at all. Installing your own RUM script closes that gap and gives you segmentation by template, device, and geography.
Five reasons your scores disagree
When a merchant tells us their Lighthouse score is great but Search Console says otherwise, the explanation is almost always one of the following.
1. Throttling does not match your audience. Lighthouse's simulated slow 4G is a fixed assumption. If a meaningful share of your traffic comes from mid tier Android phones on genuinely congested networks, real conditions are worse than the simulation. If most of your traffic is iPhone users on home Wi-Fi, real conditions are better. Either way the lab number is a guess about a population it has never met.
2. Interaction is invisible to lab tests. Lighthouse loads a page and stops. It never opens your size selector, never expands a mega menu, never triggers a cart drawer. Interaction to Next Paint is measured from real taps and clicks, so a store with a heavy JavaScript cart can pass every lab audit and still fail INP in the field.
3. Third party apps behave differently in the wild. Review widgets, upsell engines, chat, consent banners, and analytics tags often load conditionally, on a delay, or only for returning visitors. A synthetic run with a clean profile may skip half of them. Real visitors get all of them, and each one competes for the same main thread. This is the single most common gap we see on Shopify stores with a large app stack.
4. You are testing the wrong page. Teams test the homepage because it is the easiest URL to paste into a tool. Most revenue arrives on product and collection templates, which carry more images, more variant logic, and more app embeds. Field data covers whatever your visitors actually loaded, which is rarely the homepage.
5. Layout shift accumulates over a full session. Cumulative Layout Shift in the field keeps counting as a visitor scrolls, which surfaces lazy loaded sections, sticky promo bars, and late arriving fonts that a lab run measuring only the initial viewport will never record.
Which one Google actually uses
This is the part that settles most internal debates: Google's page experience signals use field data, specifically the Core Web Vitals thresholds evaluated at the 75th percentile of real user data. Your Lighthouse score is not a ranking factor. It has never been a ranking factor. We wrote a whole piece on why the Lighthouse ranking myth persists, and the confusion is understandable given that PageSpeed Insights displays both datasets on the same screen.
The practical implication is uncomfortable for anyone reporting a score to leadership. You can raise a Lighthouse score by deferring a script that no real visitor was waiting on, and change nothing about rankings or revenue. You can also leave the score untouched while cutting real world LCP by a second, because the fix targeted a bottleneck that only appears under real network conditions. The score is a proxy. Field data is the outcome.
Revenue behaves the same way. The relationship between real world speed and conversion rate shows up in field data, not in synthetic scores, which is why our own analysis of 100ms speed improvements across Shopify stores is built on real visitor sessions rather than lab runs.
A workflow that uses both
Stop treating this as a choice. The two datasets belong at different stages of the same loop.
Start in the field to choose the target. Open the Core Web Vitals report in Search Console and group the failing URLs by template. If 12,000 product URLs fail mobile LCP and your homepage passes, your project is the product template. Never pick a performance project from a lab score.
Move to the lab to find the cause. Take three representative failing URLs and run them through Lighthouse and WebPageTest. Read the waterfall, not the score. Look for render blocking requests before the hero image, main thread tasks over 50ms, and uncompressed or unsized media. This is where synthetic detail earns its keep, and our guide on how to test website speed properly walks through the setup.
Ship one change at a time. Bundling five optimizations into one release makes attribution impossible when the field data moves.
Return to the field to confirm. Because CrUX uses a 28 day rolling window, expect four weeks before the public number fully reflects your change, with partial movement visible sooner. If you cannot wait a month to know whether a fix worked, that is the argument for running your own RUM, which reports within hours.
Segment before you celebrate. An improvement that only helps desktop visitors in one region can look like a win in aggregate while your mobile traffic, which is usually the majority and the slower cohort, stays exactly where it was.
Fixes that move field data, not just the score
Some optimizations flatter a lab score without changing much for real people. Others do the opposite. The ones that reliably move the 75th percentile share a trait: they reduce work or distance for the slowest quarter of your visitors.
Cutting Time to First Byte by serving HTML from an edge location near the visitor helps every metric downstream, and it helps the visitor 2,000 miles from your origin far more than the one next door, which is exactly the cohort sitting at your 75th percentile. Prioritizing the hero image with a fetchpriority hint and correct dimensions attacks LCP where real networks are slow. Deferring or removing third party scripts that never render pixels above the fold frees the main thread that INP depends on. Reserving space for anything injected after load kills the layout shift that only real scrolling exposes.
Conversely, chasing the last few Lighthouse points by micro optimizing a script that fires after the page is interactive, or by lazy loading images that were already below the fold, tends to produce a nicer number and an unchanged customer experience. Ask one question before every performance ticket: which real cohort gets faster, and by how much? If you cannot answer it, you are optimizing a test rather than a store.
Nostra's edge delivery engine sits in front of your storefront and handles the structural side of this automatically: HTML served from the edge, images optimized and resized per device, and non critical JavaScript deferred without theme surgery. Merchants see the change in field data because the work targets real conditions rather than a throttled lab profile. See what your store's real user metrics look like with Nostra, and bring your Search Console numbers to the conversation rather than your Lighthouse score.
Frequently asked questions
Why is my Lighthouse score 95 but Core Web Vitals failing?
Because the score reflects one throttled load of one URL, while the Core Web Vitals report reflects the 75th percentile of real visits across every URL in that group over 28 days. The usual culprits are interaction heavy templates that lab tests never exercise, third party apps that load only for real visitors, and testing the homepage while product pages carry the traffic.
Is Lighthouse score a Google ranking factor?
No. Google's page experience signals evaluate Core Web Vitals from field data at the 75th percentile. The Lighthouse 0 to 100 performance score is a diagnostic aid produced by a Chrome tool and is not used in ranking.
How long does field data take to update after a fix?
Chrome User Experience Report data uses a 28 day rolling window, so the public number takes roughly a month to fully reflect a change, with directional movement appearing within one to two weeks. Your own RUM instrumentation reports within hours and is the only practical way to validate a fix quickly.
Should I use Shopify's speed score or PageSpeed Insights?
Shopify's speed score is lab data: an averaged Lighthouse run across your home page, a product page, and a collection page. It is useful as a rough internal trend line but it is not what Google evaluates. Use Search Console for the number that matters and Shopify's score only for directional comparison over time.
Why do two Lighthouse runs on the same page give different scores?
Synthetic runs vary with CPU contention on the testing machine, network conditions, CDN cache state, and which third party responses arrive first. Variance of five to ten points between runs is normal. Run any test three times and use the median, and never treat a single run as a baseline.
Do I need paid RUM tooling, or is CrUX enough?
CrUX is enough to know whether you have a problem and roughly where. It is not enough to know whether last Tuesday's theme update caused a regression, or how a specific collection template performs for mobile visitors in a specific market. If performance is tied to revenue targets, dedicated RUM with template and device segmentation pays for itself in avoided guesswork.


