Checkout page conversion rate is the percentage of shoppers who start checkout and go on to complete a purchase. You calculate it by dividing completed orders by sessions that began checkout, then multiplying by 100. Most stores land between roughly 30% and 60%, and mobile almost always sits below desktop.
This metric is different from your site-wide conversion rate, which divides orders by all sessions and usually lands in the low single digits. Checkout conversion looks only at people who already showed buying intent. That makes it the cleanest read on whether your cart, forms, payment options, page speed and trust signals help or hurt.
This guide covers why the number matters, how to calculate it with a worked example, what benchmarks to compare against, and how to improve it. At Nostra AI we work on storefront speed, bot traffic and QA for ecommerce brands, so we also cover the measurement problems that quietly make this number look worse than it is.
Checkout page conversion rate matters because it measures the last step before revenue, where every lost shopper is a sale you already paid to earn. Fixing it usually costs less than buying more traffic.
Your site-wide rate blends browsers, researchers and buyers. The checkout rate strips out everyone who never intended to buy, so a drop points at the checkout itself: a broken payment option, a slow page, a surprise shipping fee. If your site-wide rate falls while checkout conversion holds steady, the problem sits earlier in the funnel.
Say 600 sessions a month reach checkout, 240 complete (a 40% rate), and your average order is $85. That is $20,400 in revenue. Lift the rate to 44% and you get 264 orders, which is 24 more orders and $2,040 extra, with no added ad spend.
Checkout is the cheapest place to find revenue, because every shopper there has already been paid for.
The formula is completed purchases ÷ checkout sessions × 100, using the same time period for both numbers. A worked funnel shows how it differs from the other rates you track.
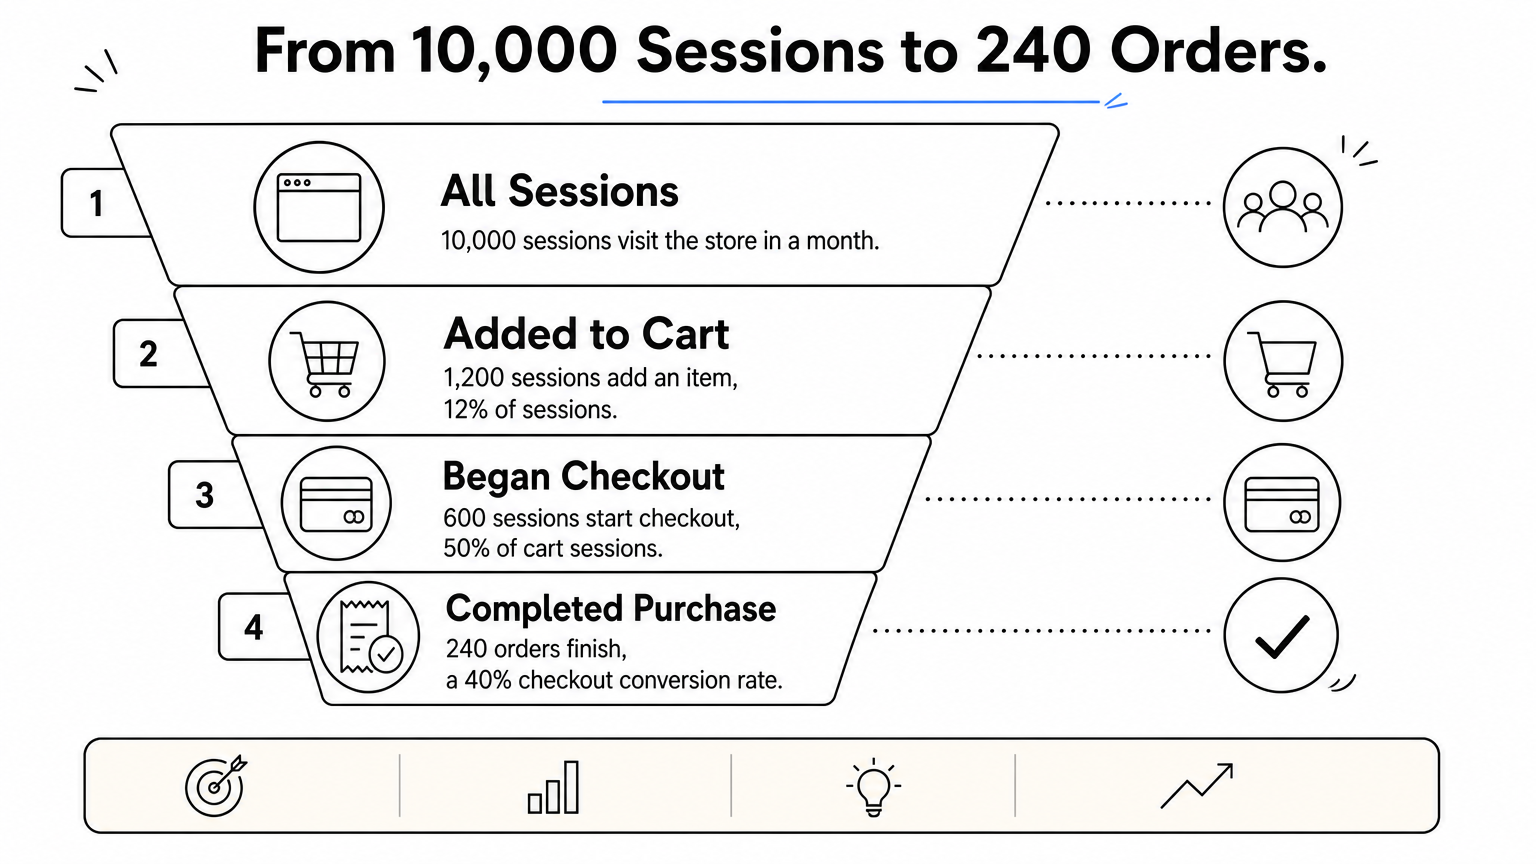
Here is a month of data for a store with 10,000 sessions:
| Funnel step | Count | Rate |
|---|---|---|
| Sessions | 10,000 | |
| Added to cart | 1,200 | 12% of sessions |
| Began checkout | 600 | 50% of cart sessions |
| Completed purchase | 240 | 40% checkout conversion |
| Site-wide conversion | 240 of 10,000 | 2.4% |
Same orders, two very different numbers. Always say which denominator you mean when you report a rate.
In GA4, use the begin_checkout and purchase events, then divide the purchase count by the begin_checkout count for the same sessions. In Shopify, the conversion funnel report shows sessions that reached checkout and sessions that completed it. Segment by device, traffic source and new versus returning shoppers. A blended average hides the segment that is actually leaking.
Divide orders by checkout starts, not by total sessions, or you are measuring a different metric.
A good checkout conversion rate for most ecommerce stores falls between about 30% and 60%, and the middle of that range is a healthy target. Published sources disagree because they measure different stores, devices and checkout definitions.
| Measure | Typical figure |
|---|---|
| Site-wide ecommerce conversion | low single digits |
| Checkout conversion, commonly cited range | about 30% to 60% |
| Desktop checkout, one large form-analytics dataset | about 37% |
| Mobile checkout, same dataset | about 31% |
Mobile trails desktop because typing card details and addresses on a small screen is harder. Treat the gap as an opportunity: if mobile is your majority traffic, your blended rate depends on it.
Context decides everything. A 10% or 12% site-wide conversion rate is exceptional for ecommerce. A 10% or 12% checkout conversion rate is a serious problem, because it means about nine in ten shoppers who started checkout left. Compare your number to your own history first, then to a benchmark for your device mix and price point.
A good rate is one that beats your own trailing average and sits inside your segment's benchmark, not one that matches a headline number.
Improve it by removing friction in the form and payment steps, then fixing speed and bugs, and by changing one thing at a time so you can see what worked.
Start with the changes that rarely backfire:
A checkout that loads slowly or breaks on one browser loses shoppers no redesign can recover. Dash, our speed agent, accelerates pages at the edge, with load times up to 47% faster across our brands. Patch, our QA agent, walks the journey from homepage to checkout on real desktop and mobile devices and files bug reports with reproduction steps and video. Whatever tools you use, test checkout on real phones every week, and run A/B tests on one variable at a time.
Fix what is broken and slow before you test what looks better.
Your number can mislead you when bots, tracking gaps or double-firing events distort either side of the formula. Check the data before you act on it.
Malicious bots probe checkout pages with card-testing and scraping, adding checkout sessions that never buy. That drags your rate down and makes you chase a problem that is not human. Knox, our bot agent, blocks malicious bots at the edge before they reach your analytics, while letting verified crawlers such as Googlebot through. Also exclude internal test orders from your reports.
Confirm your purchase event fires exactly once per order, including on mobile browsers and after redirects from payment providers. Short cookie lifetimes also make returning shoppers look like new visitors, which muddies attribution and audience data. Our cookie agent, Crumble, extends tracking identity from about one week to over two years. Audit your events monthly, because a broken tag can look exactly like a conversion drop.
Before you optimize the rate, make sure both the numerator and the denominator are real.
Checkout page conversion rate is completed purchases divided by checkout starts, and a healthy store usually sits between 30% and 60%, with mobile below desktop. Calculate it by device, compare it against your own history, then fix friction, speed and bugs in that order.
Clean data comes first. Bots that inflate your checkout sessions make every test harder to read, so see how Edge Protect keeps bad bots out of your funnel and measure only real shoppers.


