You open GA4, click into your reports, and see a number labeled ecommerce conversion rate that doesn't match what your finance team calculates or what your old Universal Analytics dashboard used to show. That gap is common, and it's exactly why so many ecommerce teams end up confused about ga ecommerce conversion rate right when they need clean numbers for a board meeting or a budget review.
In GA4, ecommerce conversion rate is the percentage of sessions that end in a purchase, calculated as purchases divided by total sessions, and it lives inside the Monetization reports, not tucked away in a custom metric you have to build yourself. This article walks through exactly how GA4 defines and calculates that rate, where to find it without digging through menus, and how it differs from the conversion rate definitions you may remember from GA3.
We'll also cover realistic benchmark ranges by industry, plus the traffic quality and site performance issues, like bot sessions and slow page loads, that quietly drag your reported rate down and make your store look worse than it actually performs.
Your ecommerce conversion rate is the single number that ties your marketing spend, site performance, and customer experience together into one measurable outcome. A brand pulling in 500,000 monthly sessions at a 1% conversion rate generates half the orders of an identical brand converting at 2%, without spending a dollar more on traffic. That's why growth and ecommerce leads watch this metric closer than almost anything else in GA4: it's the fastest way to tell if your store is actually working, not just getting visitors.
Because conversion rate reacts quickly to friction, a sudden drop often flags an issue days before your finance team notices a revenue shortfall. Checkout errors, slow page loads after a bad deploy, or a spike in bot traffic inflating your session count can all quietly tank the number. Teams that check ecommerce conversion rate in Google Analytics weekly, rather than monthly, catch these issues while they're still cheap to fix.
A falling conversion rate is almost always the first warning sign of a problem your dashboards haven't named yet.
Marketing teams love session counts and click-through rates, but those numbers mean nothing if sessions don't turn into orders. Conversion rate is the bridge between traffic acquisition and revenue per visitor, which is why it shows up in nearly every board deck and budget review. If you're spending more on Meta and Google ads but your conversion rate is flat or dropping, you're paying more to convert the same buyers, and that's a signal to fix the storefront before you fix the media plan.
A single site-wide conversion rate can mask real problems happening on specific pages or devices. Splitting the metric by channel, device, and landing page shows you where the store is actually leaking sales:
Slicing the data this way turns a single number into a diagnostic tool instead of a vanity metric. Platforms like Nostra AI are built around exactly this idea: agents that watch site speed, bot traffic, and customer identity in real time so the conversion rate you see in GA4 reflects real buying behavior, not noise from bad bots or slow pages dragging the number down.
The ecommerce conversion rate calculation in Google Analytics looks simple on paper: the ecommerce conversion rate formula is total purchases divided by total sessions, multiplied by 100 to get a percentage. GA4 pulls the purchase count from your purchase event, so if your tracking setup fires that event incorrectly, either duplicating on page refresh or missing on certain checkout flows, your reported rate will be wrong no matter how healthy your actual sales are. Before you trust the number, confirm your purchase event only fires once per completed order.
Here's the math GA4 runs behind the scenes:
Ecommerce conversion rate = (Purchases ÷ Total sessions) × 100

Example:
450 purchases ÷ 30,000 sessions = 0.015
0.015 × 100 = 1.5% ecommerce conversion rate
Your conversion rate is only as accurate as your purchase event, garbage tracking data produces a garbage rate no matter how well your store performs.
Unlike Universal Analytics, which calculated ecommerce conversion rate in Google Analytics against transactions per session at the property level with more configuration options, GA4 ties the metric directly to sessions and standardizes it across every property using the same event-based model.
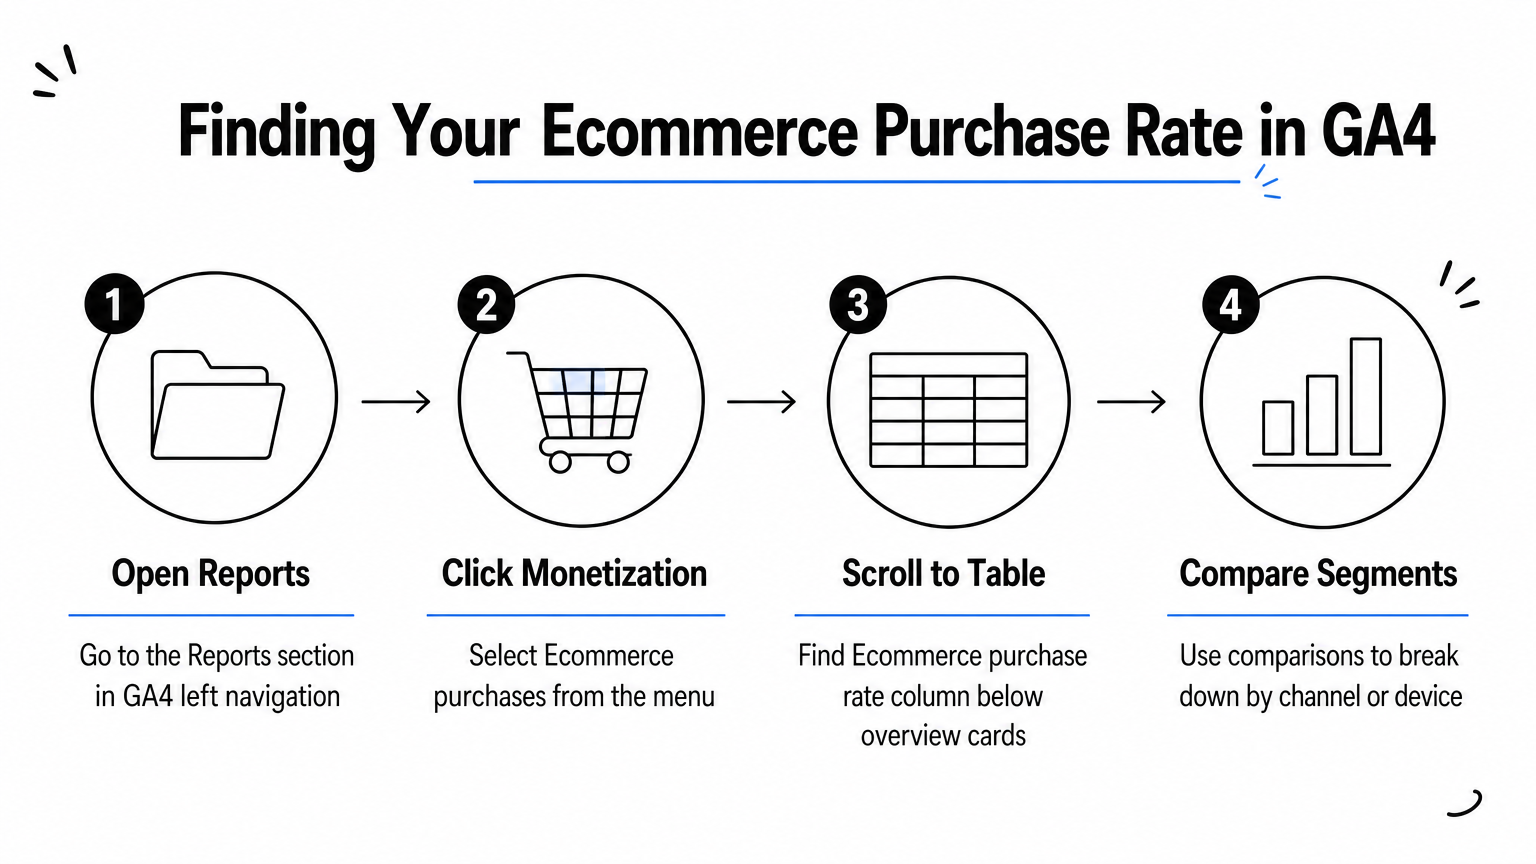
You don't need a custom report to see your ecommerce conversion rate GA4 number. Follow these steps:
If you want the metric in a custom exploration instead, build a free-form report and add "Ecommerce purchase rate" as a metric, then break it down by any dimension you need, like landing page or campaign source.
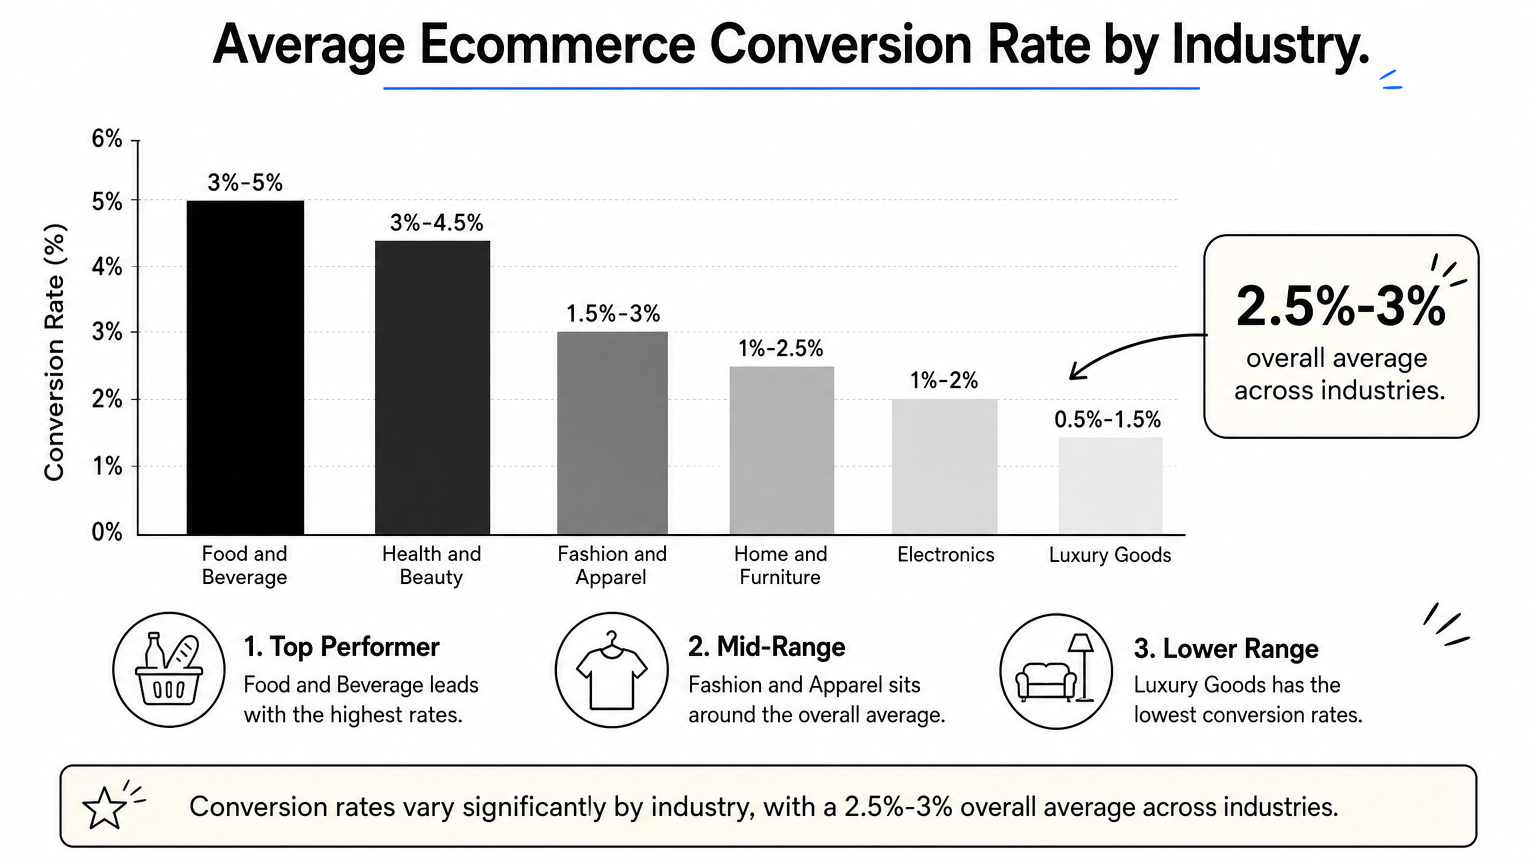
Most ecommerce stores land somewhere between 1% and 4%, with the overall average hovering around 2.5% to 3% across industries, which is roughly where a healthy store should sit, according to data Google and industry analysts have tracked for years. Numbers outside that range don't automatically mean something's wrong. A luxury skincare brand selling a $200 serum will naturally convert lower than a commodity retailer selling $15 phone cases, because higher price points mean longer research cycles before purchase.
A conversion rate only means something when you compare it against your own history and your own category, not against a generic industry average.
Use these industry conversion rate averages as a starting point, then adjust for your own price point, traffic mix, and seasonality:
| Industry | Typical conversion rate range |
|---|---|
| Health and beauty | 3% - 4.5% |
| Fashion and apparel | 1.5% - 3% |
| Electronics | 1% - 2% |
| Home and furniture | 1% - 2.5% |
| Luxury goods | 0.5% - 1.5% |
| Food and beverage | 3% - 5% |
Comparing your ecommerce conversion rate GA4 figure to a generic benchmark can mislead you if you're not also accounting for traffic quality. A store running heavy retargeting campaigns to warm audiences should see a higher rate than one running cold prospecting ads, and neither number tells you much without knowing which channel mix produced it. Bot traffic makes this worse: sessions from scrapers and fake crawlers inflate your denominator without ever buying, quietly dragging a genuinely healthy 3% rate down to a reported 2%.
Tracking your google analytics ecommerce conversion rate month over month, segmented by channel and device, gives you a far more useful baseline than any external benchmark table. Once you know your own historic range, a two-point drop tells you something's broken long before an industry comparison ever would.
Before you trust any rate GA4 shows you, rule out the tracking errors that make a healthy store look weak. Most inflated or deflated ecommerce conversion rate numbers trace back to a handful of setup mistakes, not an actual drop in buyer behavior. Fixing these is usually faster than any storefront redesign.
Automated bots, scrapers, and fake crawlers hit your site constantly, and every one of those visits counts as a session in GA4 unless you're filtering them out. A store pulling in 40,000 sessions might have 6,000 of them from non-human traffic, which quietly drags a real 3% rate down to a reported 2.5%, so it's worth learning the signs that separate bots from real shoppers. Bot traffic rarely announces itself in standard reports, so you won't spot it without knowing how to find and filter bots in GA4. Tools built specifically to detect and block this traffic, like Nostra AI's Knox agent, stop the sessions before they ever hit your analytics.
If bots are padding your session count, every conversion rate you calculate is wrong by definition.
Event misfires are the second most common culprit. Watch for these:
Catching these requires regularly auditing your purchase event against your actual order count in your ecommerce platform.
GA4's default 30-minute session timeout can split a single shopping visit into two sessions if a customer browses, leaves, and returns later, which lowers your reported rate without any real change in buying behavior. Reviewing your timeout settings against your typical browsing pattern keeps the denominator honest.
Once you trust the number GA4 shows you, the real work starts. Improving your ecommerce conversion rate almost always comes down to removing friction, not adding more traffic, and most of the ways to increase ecommerce conversion rate start with that principle. Every extra second of load time, every unresolved checkout bug, and every bot session muddying your data pulls the real rate further from what your reports show.
Speed is the fastest lever most teams can pull. Product and checkout pages that load in under two seconds routinely outconvert slower pages by a wide margin, and page speed improvements compound across every channel you already pay for, lifting conversion rate and average order value together. An edge-based agent like Nostra AI's Dash accelerates load times at the edge without a replatform or a developer sprint, which matters if your engineering team has a backlog longer than your patience.
A one-second delay on your checkout page costs you more orders than most marketing tweaks will ever recover.
Most shoppers who hit a broken add-to-cart button or a stuck payment field don't file a support ticket, they just leave. Running automated QA across the full purchase journey catches these breaks before they cost you orders. Nostra AI's Patch agent tests real devices end to end and files reproduction steps automatically, so your team fixes the bug instead of hunting for it.
Here's a quick checklist worth running monthly:
Fixing these five areas together, speed, bugs, bots, and tracking accuracy, moves the needle far more than chasing a generic industry benchmark ever will.
Your ecommerce conversion rate in GA4 is only useful once you trust it. Get the tracking right, know your own historic range, and segment by channel and device before you compare yourself to any industry benchmark. From there, the fixes are straightforward: speed up your slowest pages, catch the bugs shoppers never report, and stop letting bot sessions inflate your denominator.
That last piece matters more than most teams realize. A store with 15% bot traffic is comparing apples to oranges every time it checks its ecommerce conversion rate google analytics number against last quarter's results. Clean traffic gives you a number you can actually act on.
If bad bots are quietly padding your sessions and dragging your reported rate down, start there. See how Nostra stops bad bots before they inflate your session count and get a conversion rate that reflects real buyers, not noise.


.svg)
