You check Google Ads and see a below average landing page experience rating, and your quality score drops along with it. Your ad copy hasn't changed. Your bids haven't changed. But suddenly you're paying more per click for the same keywords, and nobody on your team can tell you exactly why. If you've searched how is landing page experience calculated, you already know Google keeps the formula frustratingly vague, and that vagueness costs real money every day your campaigns run.
Here's the direct answer: Google Ads scores your landing page experience by comparing your page against similar advertisers, looking at page load speed, mobile usability, relevance between your ad and page content, navigation ease, and transparency around your business. It's one third of your quality score, alongside expected clickthrough rate and ad relevance, and it directly affects your cost per click and ad rank in every auction you enter.
In this article, you'll get a breakdown of exactly what Google measures, how the rating scale works from below average to above average, and which factors carry the most weight. We'll also cover practical fixes, including where site speed problems typically hide and why they're often the fastest lever you can pull to improve your rating without touching your ad copy at all.
Google Ads doesn't charge every advertiser the same amount for the same keyword. Two competitors bidding on "organic skincare serum" can pay wildly different prices per click, and the gap often traces back to quality score, the hidden multiplier that decides how far your budget stretches. Landing page experience is one of three inputs into that score, and it's the one most advertisers ignore because it lives outside the ad platform itself. Understanding adwords landing page experience matters because Google rewards advertisers who send users somewhere useful and penalizes those who don't, regardless of how good the ad copy looks.
Quality score runs on a 1 to 10 scale, and Google uses it as a multiplier in the ad auction formula: Ad Rank equals your bid times your quality score, plus other auction-time factors. A below average landing page rating drags your overall quality score down, which means you need a higher bid to win the same ad position a competitor gets with a lower bid and a better score. In practice, advertisers with poor landing page ratings routinely pay 20 to 30 percent more per click for identical keywords compared to advertisers with above average ratings.
A weak landing page experience doesn't just hurt conversions, it makes every click you buy more expensive.
The table below shows how the rating tiers typically translate to real auction outcomes, based on patterns we've seen across ecommerce accounts running high-volume search campaigns.
| Landing Page Rating | Typical Impact on CPC | Typical Impact on Ad Position |
|---|---|---|
| Above average | Baseline or lower CPC | Easier top-of-page placement |
| Average | Slight CPC increase | Position holds with steady bids |
| Below average | 15-30% higher CPC needed | Requires bid increases to maintain rank |
Quality score doesn't apply once and stay fixed. Google recalculates it for every single auction, which means a slow-loading page or a confusing checkout flow taxes you thousands of times a day if you're running high-volume campaigns. Recovering that lost margin isn't a one-time fix, either. Search advertisers often assume they can outbid a poor score, and you can, but you're paying a permanent tax on every impression until you fix the underlying page. Reducing that tax is exactly why edge-based site speed tools like Nostra AI's Dash exist for ecommerce brands who'd rather fix the root cause than keep raising bids.
Searchers who click your ad and land on a broken, slow, or misleading page don't just bounce, they lose trust in Google's search results too. That's the real reason google ads quality score landing page experience carries so much weight: Google is protecting its own product experience, not just yours. Trustworthy, fast, relevant landing pages keep users clicking on ads in general, which is why Google's own Quality Score documentation explicitly ties landing page experience to long-term ad performance rather than a single campaign metric.
Understanding this connection changes how you should think about fixing your rating. You're not gaming an algorithm, you're closing the gap between what your ad promises and what your page delivers. Advertisers who treat landing page experience as a checkbox usually see temporary bumps that fade within a few weeks. Advertisers who treat it as an ongoing part of site health, alongside speed monitoring and mobile testing, see the rating hold steady even as traffic scales up during peak seasons like Black Friday or back-to-school.
Google groups landing page experience into a handful of measurable factors, and it publishes them plainly even though the exact weighting stays private. If you're wondering what is landing page experience in google adwords, this is the checklist Google actually runs against your page every time it recalculates quality score. None of these factors work in isolation. Google looks at them together and compares your result to advertisers running similar pages for similar keywords, so a page that would score fine in one niche might score below average in a more competitive one.
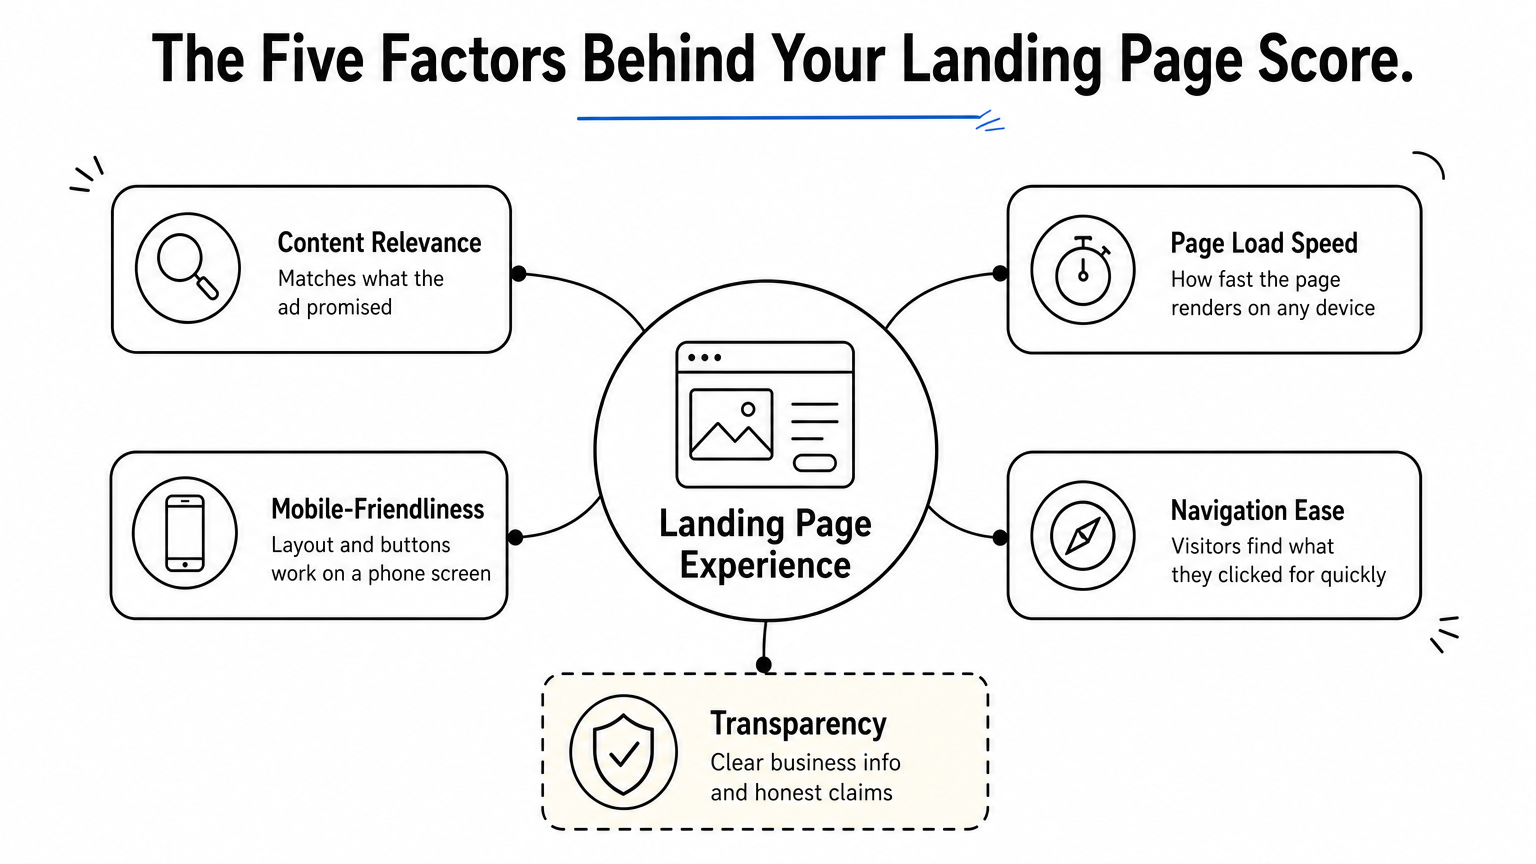
Google's own guidance breaks the score into these categories, and each one maps to which attributes describe a good landing page experience on your site, so you can audit and fix them directly.
Google isn't scoring your design, it's scoring whether your page delivers on the click you paid for.
In our experience working with ecommerce accounts, page load speed and content relevance move the needle fastest because they're the easiest to measure objectively and the easiest for Google's crawlers to flag automatically. Mobile-friendliness follows close behind, especially now that most ecommerce traffic arrives on phones. Transparency and navigation matter, but they tend to only tank a score when something is genuinely broken, like a checkout that loops back to the homepage or a page missing basic contact information.
| Factor | What Google Checks | How Fast You Can Fix It |
|---|---|---|
| Content relevance | Ad copy vs. page headline and offer | Days |
| Page load speed | Core Web Vitals, time to interactive | Days to weeks |
| Mobile-friendliness | Responsive layout, tap targets | Weeks |
| Navigation ease | Click depth, menu clarity | Weeks |
| Transparency | Business info, honest claims | Days |
Speed and relevance sit at the top of that table for a reason: they're the two factors you can usually fix without a full redesign, which is exactly why they're worth tackling first.
Start with the fixes that touch the fewest moving parts. You don't need a redesign to move a below average rating to average, you need to close specific gaps that Google's crawlers can already see. Most ecommerce accounts we've reviewed get faster wins from technical fixes than from landing page optimization tips for enterprise ecommerce sites aimed at copy, simply because copy relevance is usually already close, while page speed and mobile rendering are where the real damage hides.
Optimize your Core Web Vitals and understand what each one scores first, because Google measures load speed on real user data, not just a lab test. Compress images, defer non-critical scripts, and get your largest content element to render fast on mobile connections, since that's what most of your ecommerce traffic runs on. This is exactly the layer where an edge-based speed agent like Nostra AI's Dash does the heavy lifting automatically, without engineering time spent rebuilding your theme or replatforming your storefront.
If your page takes more than three seconds to load on mobile, no amount of copy tweaking will save your rating.
Rewrite your page headline so it mirrors the promise in your ad, not just the general product category. A searcher who clicks "30% off organic serum" should land on a page that says exactly that above the fold, not a generic homepage. Vague copy-to-page mismatches quietly account for a large share of below average ratings, and they're often the cheapest fix on this whole list.
Test your checkout flow and product pages on an actual phone, not just a browser resize, and work through the five steps to a seamless mobile store experience while you're there. Tap targets that are too small, pop-ups that block content, and menus that require pinching to read all drag your score down even when your desktop experience looks fine.
Publish clear contact information, accurate shipping and return policies, and honest urgency messaging. Skip countdown timers that reset every visit, since Google's guidelines flag deceptive urgency as a transparency issue.
| Fix | Effort Level | Typical Timeline |
|---|---|---|
| Compress images and scripts | Low | Days |
| Rewrite headline for ad match | Low | Days |
| Mobile tap target audit | Medium | 1-2 weeks |
| Add trust and policy pages | Low | Days |
Work through this list in order, and you'll usually see your rating shift within a few weeks of Google recalculating your score.
Open your Google Ads account and navigate to the keyword tab, since that's where the landing page experience column actually lives, not on the campaign overview page. Google Ads doesn't surface this rating by default, so you'll need to add it as a column: click the columns icon, choose "Modify columns," then look under "Quality Score" for the three sub-metrics, including landing page experience. Once it's added, you'll see one of five ratings next to each keyword: below average, average, above average, or a blank result if Google hasn't gathered enough data yet, and a dedicated landing page experience tool can fill in the detail Google leaves out.
Quality score itself only shows a number from 1 to 10, but the landing page experience component shows a relative rating instead, comparing your page against advertisers targeting similar keywords. A blank cell usually means low search volume, not a hidden problem, so don't panic if a long-tail keyword shows no data at all.
A blank landing page rating isn't a red flag, it just means Google hasn't seen enough clicks yet to judge you.
| Rating Shown | What It Means | What To Do |
|---|---|---|
| Above average | Page outperforms similar advertisers | Maintain current setup |
| Average | Page performs on par with competitors | Look for incremental fixes |
| Below average | Page underperforms similar advertisers | Prioritize speed and relevance fixes |
| No data | Not enough impressions yet | Wait or expand keyword volume |
Break the data down by device before drawing conclusions, since a page can score fine on desktop and land below average on mobile at the same time. Google Ads lets you segment any report by device type, and ecommerce accounts almost always find their weakest rating tied to mobile load times specifically, which is the same reason mobile and desktop conversion rates drift so far apart. Filtering this way tells you exactly where to focus instead of guessing at a full-site redesign.
Google's own PageSpeed Insights tool pulls from the same Core Web Vitals data that feeds your quality score, so run your top landing pages through it alongside your Ads account, following a repeatable process for testing website speed the right way. Comparing the two data sources helps confirm whether a below average rating traces back to speed, mobile rendering, or something else entirely, and it gives you a concrete number to track as you make fixes with a tool like Nostra AI's Dash.
Slow third-party app scripts sneak into most ecommerce accounts through review widgets, chat plugins, and retargeting pixels that nobody remembers installing. Each one adds render-blocking weight to your page, and Google's crawlers see the cumulative delay even if your core theme is fast. Third-party bloat is one of the most common causes of a below average rating we see in accounts that otherwise look clean on paper.
Redirect chains cause similar damage. A visitor clicks your ad, lands on a redirect that bounces to a UTM-tagged URL, then bounces again to the actual product page, and each hop adds latency Google measures directly. Redirect chains rarely show up in a quick manual check of the page, but they show up clearly in load-time data, so it pays to trace your full click path from ad to final URL at least once a quarter.
Interstitial popups that cover your page before a visitor sees your offer count against you, especially on mobile screens where a popup can eat the entire viewport. Email capture popups and cookie banners aren't inherently penalized, but a popup that blocks the content your ad promised is exactly the kind of mismatch Google's transparency criteria flags. Test your top landing pages on an actual phone with a fresh session, since popups often only trigger for first-time visitors and get missed in repeat testing.
The fastest way to lose a rating is to hide the thing you advertised behind a popup.
Seasonal spikes reveal problems that stay hidden the rest of the year. A page that loads fine at normal traffic volume can slow to a crawl during a Black Friday surge, and Google recalculates your rating in real time as that happens, not after the sale ends. Seasonal spikes hit ecommerce accounts harder than any other vertical because ad spend and traffic both climb at once, right when infrastructure is least forgiving of shortcuts, which is why a BFCM site speed checklist is worth running weeks before the surge.
Outdated caching rules compound all of this. A page that was fast six months ago can quietly slow down as new apps, scripts, and images pile onto the theme without anyone revisiting the caching setup. Outdated caching rarely gets flagged until someone actually audits the page, which is why running a fresh speed check every quarter catches problems before Google's rating does, and why edge-based tools that continuously monitor performance tend to catch these regressions faster than a manual review schedule ever will.
Landing page experience isn't a mystery score Google hides from you on purpose. It's a measurable readout of speed, relevance, mobile usability, navigation, and trust, and every factor here is one you can audit and fix without waiting on a redesign. Fixing your rating starts with the cheapest wins: match your headline to your ad, compress your images, and check your checkout on an actual phone before you touch anything else.
But speed and clean data only hold if the traffic hitting your page is real. Bot traffic distorts the same Core Web Vitals and engagement signals Google uses to judge you, quietly dragging down a score you're otherwise fixing correctly. If you're serious about protecting both your quality score and your ad spend, start by cutting the noise at the source and keep fake traffic out of your funnel in real time.


.svg)
