
Lighthouse Core Web Vitals pairs two different things. Lighthouse is Google's open-source tool that tests a page in one simulated lab load. Core Web Vitals are three metrics that Google measures on real visitors: Largest Contentful Paint (LCP), Interaction to Next Paint (INP), and Cumulative Layout Shift (CLS). Lighthouse reports lab estimates of LCP and CLS, and it uses Total Blocking Time as a stand-in for INP. It diagnoses problems. It does not decide whether you pass.
That difference explains why a page can score 95 in Lighthouse and still fail the Core Web Vitals assessment in Search Console. This article covers why the two diverge, how to run a Core Web Vitals test in Lighthouse, how to read each metric in the report, what a good score means, and how to confirm your fixes with real-user data.
At Nostra AI we work on ecommerce storefront speed every day, so we see this gap constantly. Teams chase a Lighthouse number while shoppers on mid-range phones experience something else. The sections below show you how to use Lighthouse for what it does well.
Lighthouse is a tool, and Core Web Vitals are a scorecard. Lighthouse runs one simulated page load and reports what it saw. Core Web Vitals are judged on real visits collected from Chrome users over time. Mixing them up is the most common mistake in speed work.
Lab data comes from a controlled test. Lighthouse loads your page on an emulated device with throttled CPU and network, so the result is repeatable and works on staging sites or pages behind a login. The cost is realism. No real person scrolls, taps, or opens your cookie banner during the test.
Field data comes from actual visitors. Google collects it in the Chrome User Experience Report (CrUX), and the Core Web Vitals assessment uses the 75th percentile of those visits. A page passes only when three out of four real visits are good. Field data shows what happened, but it rarely tells you why.
The table below sets the two side by side.
| Lighthouse | Core Web Vitals | |
|---|---|---|
| What it is | Testing tool with many audits | Three user-experience metrics |
| Data type | Lab, one simulated load | Field, real Chrome visits |
| Loading | LCP (lab estimate) | LCP |
| Responsiveness | Total Blocking Time as a proxy | INP |
| Visual stability | CLS during page load | CLS across the visit |
| Other categories | Accessibility, SEO, best practices | None |
| Best use | Diagnosing and catching regressions | Judging real user experience |
Google's ranking systems use the field data. Your Lighthouse score is not a ranking input, but it points at the same problems that hurt your field numbers, such as heavy scripts and slow images.
Lighthouse tells you what to fix. Field data tells you whether it worked.
Consider a hypothetical store. Its product page scores 94 in Lighthouse on mobile, so the team moves on. Real shoppers arrive on mid-range phones over busy mobile networks, open a chat widget, and tap filters while scripts still run. Their 75th percentile INP lands at 280 ms, above the 200 ms "good" limit. The page fails the assessment despite a green lab score, and Lighthouse could never have caught it because it does not interact with the page.
The fix is not to ignore Lighthouse. Use it as the debugger and field data as the judge. The rest of this article follows that split.
The fastest way to run a Core Web Vitals test in Lighthouse is PageSpeed Insights. Paste a URL, click Analyze, and read the report in under a minute. Use Chrome DevTools when the page is behind a login or still on staging.
The command line suits repeated testing. Install it once, then run it against any URL, as described in Google's Lighthouse documentation.
npm install -g lighthouse
lighthouse https://www.example.com --only-categories=performance --view
A careless run produces a number you cannot compare with anything. Follow these steps for a result you can act on:
One Lighthouse run is an anecdote. The median of five is a measurement.
Lighthouse shows LCP and CLS directly in its Metrics section, and it reports Total Blocking Time (TBT) where INP would be. Read those three numbers first, then open the audits that explain them.
Google defines "good" for each vital at the 75th percentile of real visits. Learn more about the metrics in Google's Core Web Vitals overview.
| Core Web Vital | Good | Needs improvement | Poor | In Lighthouse |
|---|---|---|---|---|
| LCP | 2.5 s or less | 2.5 to 4 s | Over 4 s | Reported |
| INP | 200 ms or less | 200 to 500 ms | Over 500 ms | Not measured, TBT shown |
| CLS | 0.1 or less | 0.1 to 0.25 | Over 0.25 | Reported for load |
These are field thresholds. Lighthouse colors its lab values in a similar way, and it marks TBT green under 200 ms and red above 600 ms.
INP measures how quickly a page responds when a visitor clicks, taps, or types. Lighthouse loads the page and never interacts with it, so it cannot measure INP at all. TBT adds up the time the main thread was blocked by tasks longer than 50 ms during load. A low TBT usually goes with a decent INP, but it does not guarantee one.
To see real interaction delays, record a trace in the DevTools Performance panel while you click through the page. Field data from a real-user monitoring tool is better still.
The score is a weighted blend, and three of its five metrics are Core Web Vitals related. In current Lighthouse versions the weights are:
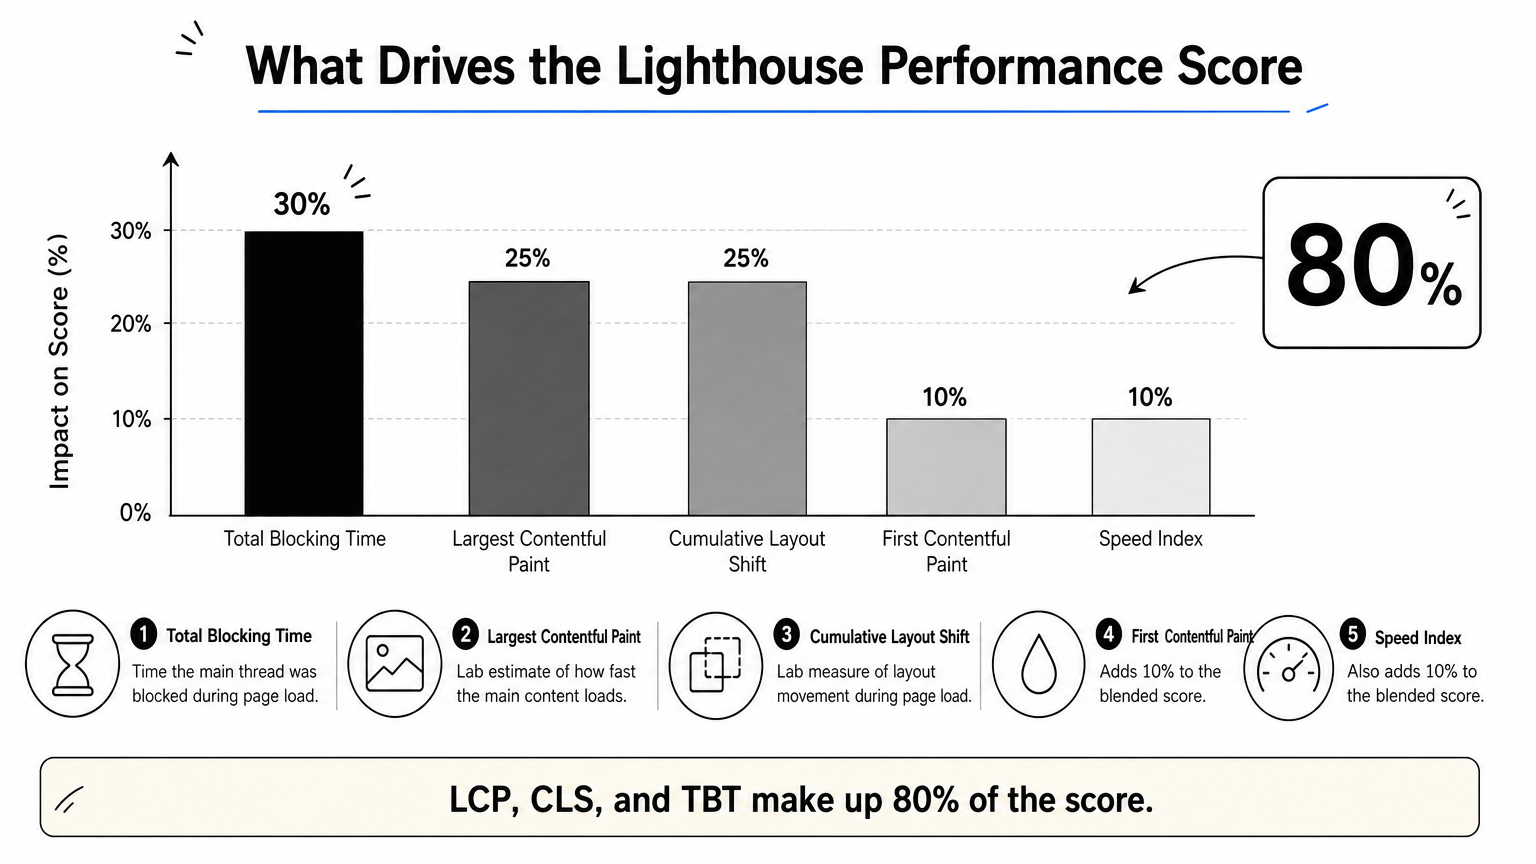
LCP, CLS, and TBT make up 80% of the score, so improving them moves the number most.
A Lighthouse score is a weighted blend of lab metrics, not a measure of how your visitors feel.
Each metric has an audit that names the cause:
A good Lighthouse performance score is 90 to 100, the green range. A score of 50 to 89 needs improvement, and 0 to 49 is poor. Treat the number as a health check, not a goal.
Scores move between runs, devices, and networks, so a swing of a few points is noise. Do not chase a perfect 100 by stripping out useful tools, such as a reviews widget or an analytics tag, just to please the audit. Aim for green on LCP, CLS, and TBT individually, which tells you more than the blended score.
The number that matters for search is different. Your page passes the Core Web Vitals assessment when LCP, INP, and CLS are all good at the 75th percentile of real visits. A 98 in the lab with a failing field result is a fail, and a 72 in the lab with a passing field result is a pass.
Yes. Google documents them as part of its page experience guidance, and Search Console still reports them for your site. They are not a trump card, though. Google says its systems prioritize helpful, relevant content first, so a strong page with average vitals can still outrank a fast, thin one.
The honest reason to fix them is that slow, jumpy pages lose shoppers. Ranking benefit comes second.
Pass the assessment for your visitors first. The ranking benefit follows.
Fix the largest lab finding first, then verify the change in field data. That verification takes weeks, not minutes, because real-user data is averaged over time.
Work down this list on each template:
CrUX uses a 28-day rolling window and judges the 75th percentile. After a fix, your faster sessions are a small slice of that window, so the score barely moves in the first week. Expect two to three weeks before the improvement shows. Check the field section in PageSpeed Insights and the Core Web Vitals report in Search Console, and do not judge a fix from a Lighthouse rerun alone.
For ecommerce stores, the first item on the fix list is often the hardest to change without engineering time. Dash, Nostra AI's Edge Delivery speed agent, caches a store's HTML at the edge and goes live with a DNS-level change, with no code changes. It improves Time to First Byte by 5 to 10x, and customers' Core Web Vitals typically improve within 14 to 28 days. Time to First Byte is not a Core Web Vital, but a faster first byte gives LCP a head start.
Fix what the lab shows, then wait for the 28-day window to prove it.
Lighthouse and Core Web Vitals work best as a pair. Lighthouse gives you a repeatable lab test that points at the cause of slow loading, layout shifts, and blocked scripts. Core Web Vitals field data tells you whether real visitors are better off. Run Lighthouse several times per template, fix what it flags, and let the 28-day window confirm the result.
If bot traffic is also inflating your sessions and muddying the analytics you use to judge speed work, Edge Protect filters it before it reaches your store.


