Luxury ecommerce conversion rate is the share of store sessions that end in a completed purchase, and in luxury it runs low by design. Most published benchmarks put it between roughly 0.7% and 2%, against about 2.5% to 3% for the average online store. One large customer sample covering the twelve months through July 2026 measured 0.72% for luxury and jewelry and 2.72% across all industries.
This guide explains why the number runs low, what the benchmarks say by industry, and what counts as a good rate. It also shows how to calculate your own rate without bot or tracking distortion, and which fixes move it. Use it to judge whether your store is underperforming or simply behaving like a luxury store.
At Nostra AI, we run speed, bot protection and QA agents for more than 300 ecommerce brands, many of them in beauty, fashion and retail. The problems below are the ones that depress or distort conversion on those storefronts.
A low luxury ecommerce conversion rate is normal because luxury purchases are expensive, infrequent and emotional. Shoppers visit several times before they buy, and many visits are browsing only. The rate alone tells you little. What matters is what each order is worth.
Mainstream shoppers often buy on the first or second visit. Luxury shoppers compare brands, save items, check return terms and wait for a payday or a gift occasion. Every visit that ends without an order counts as a session, which pulls the rate down.
Brand traffic also includes aspirational browsers who admire the product and may never buy. That is why a mass-market average is a poor yardstick. Consider a store at 0.9% with a $900 average order value (AOV) against a store at 3% with a $60 AOV. Per 1,000 sessions, the first earns $8,100 and the second $1,800. Revenue per session is the fairer comparison.
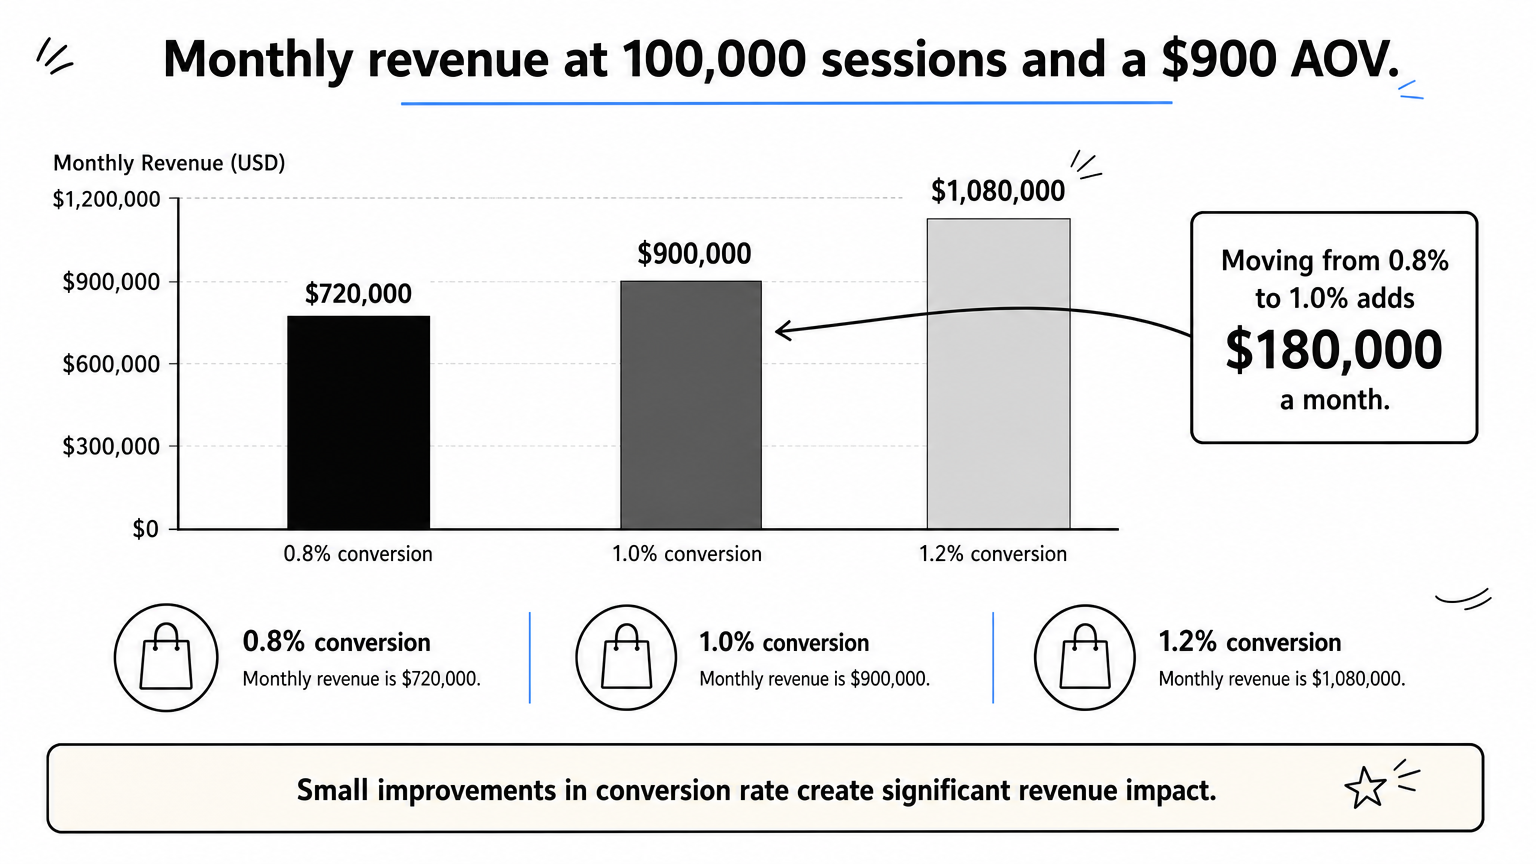
Luxury stores earn revenue from a few high-value orders, so tiny rate changes carry real money. Take a store with 100,000 monthly sessions and a $900 AOV:
| Conversion rate | Orders per month | Monthly revenue |
|---|---|---|
| 0.8% | 800 | $720,000 |
| 1.0% | 1,000 | $900,000 |
| 1.2% | 1,200 | $1,080,000 |
Moving from 0.8% to 1.0% is only 0.2 percentage points, yet it is a 25% relative gain and $180,000 more revenue per month. Revenue is not profit, since product cost, fulfillment and discounts still come out of it.
In luxury, a tenth of a point of conversion is worth more than a mass-market store's full point.
The average luxury ecommerce conversion rate falls between about 0.5% and 2%, depending on the sample. A rate of 1% to 2% is good, and anything above 2% is strong. Mainstream stores average around 2.5% to 3%, and luxury and jewelry sits at the bottom of every conversion rate by industry ranking.
This table shows a large third-party customer sample of eight industries. It is the clearest like-for-like comparison available, because every row uses the same method.
| Industry | Twelve months through July 2026 | July 2026 |
|---|---|---|
| Beauty & Personal Care | 5.39% | 5.53% |
| Food & Beverage | 4.80% | 4.57% |
| Pet Care & Veterinary Services | 4.71% | 7.68% |
| Multi-Brand Retail | 3.01% | 2.26% |
| Fashion, Accessories & Apparel | 2.77% | 2.63% |
| Consumer Goods | 2.47% | 1.61% |
| Home & Furniture | 1.22% | 1.50% |
| Luxury & Jewelry | 0.72% | 0.58% |
The sample's all-industry average was 2.72% for the twelve months and 2.55% for July 2026. Luxury and jewelry converts at roughly a quarter of the average and beauty converts more than seven times higher. Note how far a single month can drift from the longer average. Compare yearly figures with yearly figures.
You will see luxury quoted at 1% to 2%, below 1.5%, or under 1%. Those figures are not contradictory. They come from different samples, periods and definitions. Some count sessions and others count users. Some filter bots and others do not. A watch and jewelry retailer behaves differently from a luxury skincare brand, and "luxury" lumps them together.
A separate 2023 study of 2,800 Shopify stores found a 1.4% average across all industries. It put the top 20% above 3.2% and the top 10% above 4.7%. Pick one source, note its definition, and compare your own numbers only with it.
Use these bands as a working guide, built from the samples above:
| Your rate | How to read it |
|---|---|
| Below 0.5% | Under the typical luxury range. Check tracking, bots, speed and checkout first. |
| 0.5% to 1% | In line with high-ticket jewelry and watches. |
| 1% to 2% | Good. This matches the range most often cited for luxury. |
| Above 2% | Strong. Verify your measurement before celebrating. |
Two search questions come up often. A 2.5% rate is near the all-industry average, so for a luxury store it is exceptional, and the first thing to check is a low-priced product mix or unfiltered data. A 12% rate across a whole site is almost never real. It usually reflects a narrow segment, such as returning customers or email clicks, or a tracking error.
A good luxury conversion rate is 1% to 2%, and anything above that deserves a measurement audit.
The conversion rate formula is sessions with at least one completed purchase ÷ total sessions × 100. Twenty purchasing sessions out of 2,000 is 1%. The hard part is making sure both numbers are clean. In GA4, confirm that purchase is registered as a key event, and use the purchase-specific session rate, not a rate that blends in signups.

Bot sessions inflate the denominator and make a healthy store look weak. Say your analytics show 50,000 sessions and 400 orders, a 0.80% rate. If 8,000 of those sessions are bots, the real rate is 400 ÷ 42,000, or about 0.95%. That is a hypothetical example, but the pattern is common on storefronts that buy paid traffic.
Bots also waste ad spend, so a dirty denominator costs you twice. Our Knox bot agent blocks malicious bots at the edge before they reach your analytics. It lets verified crawlers such as Googlebot, ChatGPT and Claude through. Whatever tool you use, filter bots first and only then set a target.
A blended rate hides the story. Split it by device, new versus returning visitors, and traffic source. Even benchmarks disagree on mobile vs desktop conversion rate. The cross-industry sample above showed mobile at 2.88% and desktop at 2.37% for the year, while the 2023 Shopify study showed mobile at 1.2% and desktop at 1.9%. Your own segments matter more than either.
Read the rate next to AOV, return rate and repeat purchase rate. A luxury store that lifts conversion with heavy discounting may lose margin and brand value. Keep the date range, time zone and purchase definition fixed, so a change in the number means a change in the store.
Compare your rate only with a sample that shares your definition, and clean out bots first.
Start with problems you can observe: slow pages, friction at checkout, broken flows, and tracking that loses returning shoppers. Luxury buyers are unforgiving of all four, because a flawed site contradicts the brand's promise. Most gains come from removing friction, not from adding discounts.
Luxury pages lean on large images, video and zoom. That is the right instinct, but it makes speed a constant risk. Google's good-experience thresholds are Largest Contentful Paint of 2.5 seconds or less, Interaction to Next Paint of 200 milliseconds or less, and Cumulative Layout Shift of 0.1 or less, measured at the 75th percentile of page loads. You can read the details in Google's Web Vitals guidance.
Our Dash speed agent speeds pages up at the edge, so you keep the imagery. Nostra reports up to 47% faster load times and an expected revenue lift of roughly 3%, with full acceleration in about two weeks. Results vary by store, so measure conversion before and after.
Show shipping, taxes and duties early, offer guest checkout and digital wallets, and state return terms and delivery dates before payment. Keep scarcity honest. Limited editions and drops work when they are true.
Then confirm the whole path works. Our Patch QA agent walks the journey from homepage to checkout on real devices, covering Chrome and Safari on desktop, iOS and Android. It files bug reports with reproduction steps and video. For a shopper spending $900, a broken payment step usually means a lost sale, not a retry.
Luxury shoppers return over days or weeks. Browser-set cookies often expire after about a week, so the same person can look like a stranger on the fourth visit. That weakens retargeting and attribution on Meta, Google and Klaviyo. Our Crumble agent extends identity lifetime from about one week to over two years. Whatever you use, protect continuity between visits.
Fix speed, checkout and bugs first, because luxury shoppers leave quietly and rarely come back to retry.
A good luxury ecommerce conversion rate is 1% to 2%, with the largest sample averaging 0.72% and mainstream stores near 2.5% to 3%. Judge yourself against luxury, calculate the rate from clean sessions, and weigh it against AOV and revenue per session. A 0.2-point gain at a $900 AOV can add six figures a year.
Start with the denominator. Bots inflate sessions, hide your real rate and drain ad budget, so cleaning them out gives you a number you can trust. If you want to see what your traffic looks like without them, filter bot traffic with Edge Protect and re-check your conversion rate against the bands above.


