
A common question is what is LCP in Core Web Vitals, and the answer fits in a few sentences. LCP stands for Largest Contentful Paint. It is the time from the start of navigation until the largest image, video, or block of text in the visible part of the page finishes rendering. Google rates it as good at 2.5 seconds or less, measured at the 75th percentile of real visits.
LCP exists because older load events tell you little about what a visitor sees. It stands in for the moment a page looks ready. This guide explains why that moment matters, what counts as a good score, which element the browser picks, how to measure it, and how to fix a slow one.
Nostra AI builds edge speed tools for ecommerce storefronts, so we work with LCP on real stores. The advice below follows that approach: find the slow part first, then fix only that part.
LCP matters because it is the closest single number to how fast a page feels, and Google builds it into Core Web Vitals. A slow LCP means visitors stare at a half-empty page, and that is when they leave.
Older metrics such as the load event fire when files finish downloading, which can be long before or after a visitor sees anything useful. First Contentful Paint (FCP) has the opposite problem. It fires when any content appears, even a spinner or a logo. LCP sits between the two. It marks the point when the main content has likely loaded, which is the moment a visitor decides the page is working.
That makes LCP the loading metric among the three Core Web Vitals. Time to First Byte tells you the server answered. LCP tells you the visitor can see the thing they came for.
LCP is the moment a page stops looking empty and starts looking useful.
Google's ranking systems use Core Web Vitals as part of page experience, and Search Console reports them for your site. Google's documentation on Core Web Vitals is clear that good page experience does not replace relevant content. A fast LCP will not rescue an irrelevant page, so treat it as a modest ranking signal and a bigger lever on conversions.
Speed shows up in storefront data. Credo Beauty measured a 3.1% revenue-per-visitor lift over 90 days with Nostra AI's Edge Delivery. Popflex saw its conversion rate rise 7.49% in a live A/B test, alongside a 25.8% cut in Time to First Byte. Those gains come from faster pages in general, not from LCP alone. LCP is the metric that shows whether visitors feel the change.
Core Web Vitals has three metrics, and each covers one part of the experience. LCP covers loading, Interaction to Next Paint (INP) covers responsiveness, and Cumulative Layout Shift (CLS) covers visual stability. INP replaced First Input Delay in March 2024, so older articles that list FID are out of date.
| Metric | What it measures | Good | Poor |
|---|---|---|---|
| LCP | How fast the main content renders | 2.5 s or less | Over 4.0 s |
| INP | How fast the page responds to taps and clicks | 200 ms or less | Over 500 ms |
| CLS | How much content jumps around | 0.1 or less | Over 0.25 |
You can improve one without touching the others, but they interact. A late-loading ad can hurt CLS and delay LCP in the same visit.
A good LCP score is 2.5 seconds or less at the 75th percentile of page loads, with mobile and desktop assessed separately. Anything up to 4.0 seconds needs improvement, and anything beyond that is poor.
| Rating | LCP time |
|---|---|
| Good | 2.5 seconds or less |
| Needs improvement | Between 2.5 and 4.0 seconds |
| Poor | Over 4.0 seconds |
These bands are the same ones Google publishes on web.dev. They apply to field data from real visitors, not to a single test run on your laptop.
Your page passes only when 75% of visits are good. The average does not matter. Suppose 100 visits to a product page load their main image in times that you sort from fastest to slowest. If the 75th visit takes 2.8 seconds, the page needs improvement, even if the median visit took 2.1 seconds.
The rule protects slower visitors. A page that is fast on office Wi-Fi and slow on a mid-range phone on mobile data will fail. That is why you should check mobile and desktop on their own.
You pass LCP only when three out of four real visits are fast, so your slowest quarter sets the rating.
Passing is common but not universal. In the 2024 Web Almanac, 59% of mobile page visits had a good LCP, against 72% on desktop. Mobile lags because of slower networks and weaker processors, which is why a store that looks fine on a developer laptop often fails on phones.
LCP measures the largest image, video, or text block visible in the viewport when the page renders. The browser picks that element for you, and it can change while the page loads.
Only a limited set of elements can be an LCP candidate:
img elements, including the first frame of animated imagesimage elementvideo elements, using the poster image or first frame, whichever is earlierurl()Chromium-based browsers skip elements that users would not call content. These include elements with zero opacity, elements that cover the whole viewport like a backdrop, and low-detail placeholder images. Only the part of the element inside the viewport counts. A resized image is measured at its visible size or its intrinsic size, whichever is smaller.
On most pages the LCP element is an image, usually the hero or the main product photo. On phones, a headline or paragraph often wins because the images get smaller.
The browser reports a first candidate as soon as it paints the first frame, then reports a new one each time a larger element renders. The final LCP is the last candidate before the visitor first taps, scrolls, or presses a key, or before the page is hidden.
Here is an example. A product page paints its headline at 1.2 seconds. The hero image finishes rendering at 2.9 seconds and is larger than the headline. The headline was the LCP for a moment, but the page's LCP is 2.9 seconds, which needs improvement. If the image rendered at 2.2 seconds, the page would pass.
An image that has not finished loading does not count, and neither does text waiting on a web font. This is why late-loading resources are the usual cause of a high LCP.
LCP is not when the page loads. It is when the biggest visible thing finishes painting.
You measure LCP in the field with real visitor data and diagnose it in the lab with a controlled test. Use field data to decide whether you have a problem and lab data to find the cause.
| Tool | Data type | Best used for |
|---|---|---|
| Search Console (Core Web Vitals report) | Field | Finding groups of URLs that fail |
| PageSpeed Insights | Field and lab | A quick check of one URL, with both views |
| Chrome User Experience Report (CrUX) | Field | Public real-user data across Chrome visitors |
| web-vitals JavaScript library | Field | Collecting LCP from your own visitors |
| Lighthouse and Chrome DevTools | Lab | Seeing which element is the LCP and why it is slow |
| WebPageTest | Lab | Waterfalls on chosen devices and networks |
Field and lab numbers rarely match. A lab test is one simulated load, while field data is a rolling set of real visits. CrUX-based reports reflect roughly the last 28 days. When the two disagree, trust the field number for your rating and use the lab to explain it.
The simplest reliable method is Google's web-vitals library. It handles edge cases that a raw PerformanceObserver misses, such as pages opened in background tabs, back/forward cache restores, and prerendered pages.
import {onLCP} from 'web-vitals/attribution';

onLCP((metric) => {
  console.log('LCP:', metric.value, 'ms');
  console.log('LCP element and subparts:', metric.attribution);
});
Send that value to your analytics tool and report the 75th percentile, split by mobile and desktop. The attribution data names the LCP element and breaks the time into the four subparts covered in the next section. That detail turns a number into a to-do list.
If the largest element is not the most important one on your page, the Element Timing API lets you time a specific element instead.
Check field data to learn whether you have an LCP problem, then use lab tools to learn why.
To improve LCP, split the time into four subparts, find the one that is furthest over its share, and fix that one first. Guessing across all four wastes effort.
Every LCP time is the sum of four phases that run one after another, with no gaps and no overlap. Google's guidance gives the ideal split.
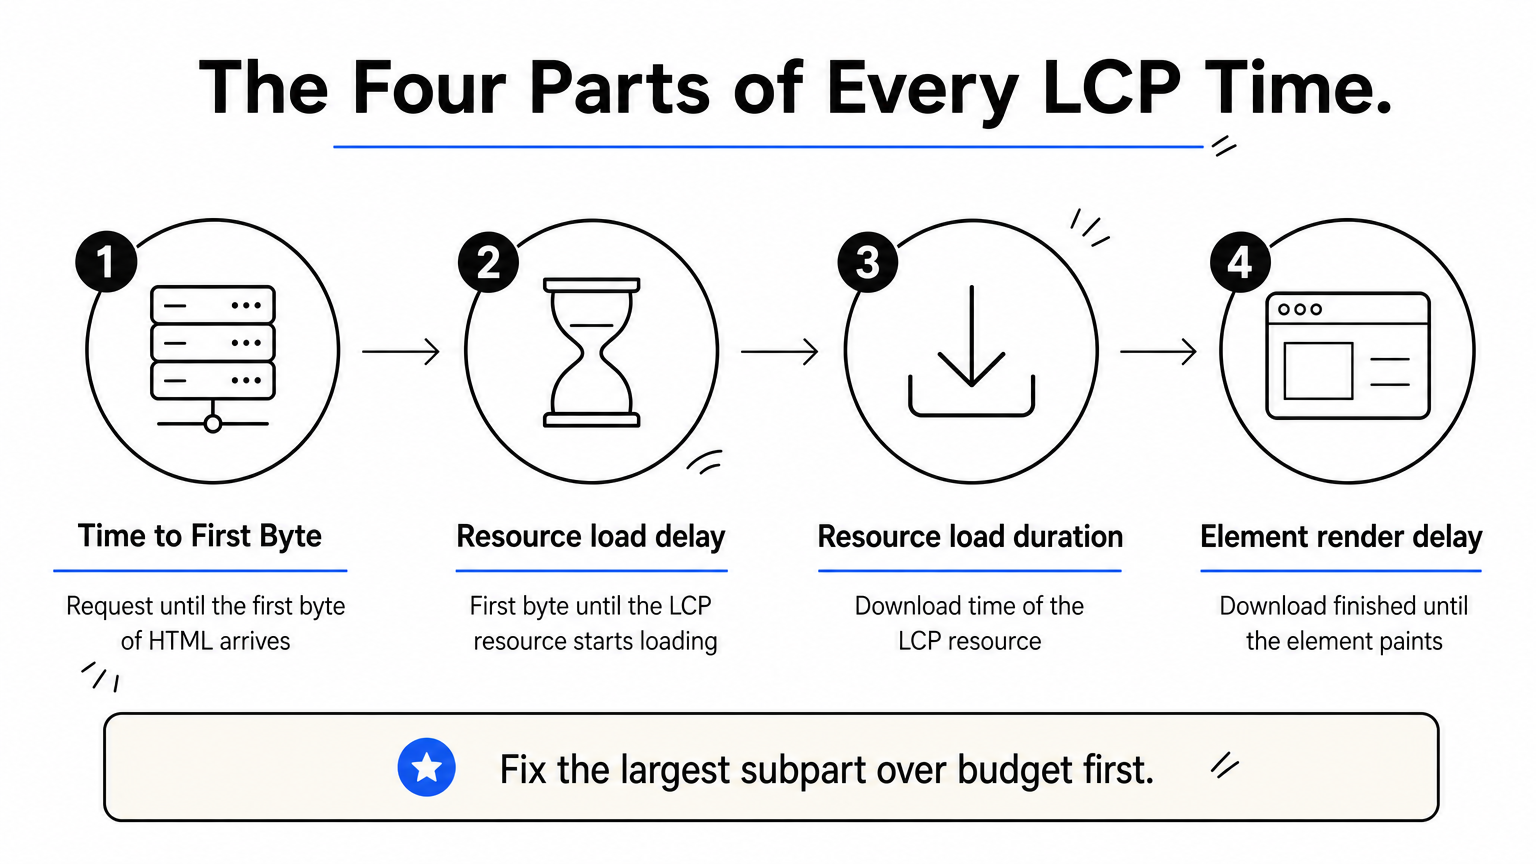
| Subpart | What it covers | Ideal share | Budget at 2.5 s | Example page |
|---|---|---|---|---|
| Time to First Byte | Request until first byte of HTML | About 40% | 1.0 s | 1.4 s |
| Resource load delay | First byte until the LCP resource starts loading | Under 10% | 0.25 s | 0.9 s |
| Resource load duration | Download time of the LCP resource | About 40% | 1.0 s | 1.1 s |
| Element render delay | Download finished until the element paints | Under 10% | 0.25 s | 0.8 s |
| Total | 100% | 2.5 s | 4.2 s |
The example page lands at 4.2 seconds, which is poor, and sits 1.7 seconds over budget. Load delay is 0.65 seconds over, render delay 0.55 over, TTFB 0.4 over, and load duration just 0.1 over. Start with load delay. Shrinking the image would barely help.
srcset.Here is a snippet for the two most common load-delay fixes:
<link rel="preload" as="image" href="/images/hero.webp" fetchpriority="high">

<img src="/images/hero.webp" fetchpriority="high"
     width="1200" height="600" alt="Product hero image">
Setting width and height also reserves space, which protects CLS.
TTFB is the subpart you cannot fix in front-end code. For ecommerce stores it is often the biggest one, and it is where edge delivery helps. Dash, the speed agent in Nostra AI's Edge Delivery, caches a store's HTML at the edge, monitors speed, and alerts you when it changes and why. You deploy it with a DNS-level change, with no code changes or downtime. Nostra AI reports a 5 to 10x improvement in TTFB, and customers' Core Web Vitals typically improve within 14 to 28 days.
Immi saw 17.4% faster TTFB and 8.1% faster LCP while running Nostra AI. That gap is the point: a big TTFB gain does not translate one-for-one into LCP, because the other three subparts still count. Fix the server side first if TTFB is your largest share, then return to the table.
Fix the largest subpart over budget first, because the other three will not hide a slow server.
The most common LCP mistakes are lazy-loading the hero image, letting a late element steal the LCP slot, and optimizing for a lab score instead of real visitors.
Some problems come from setup, not from slow servers:
Some teams game the metric, for example by inlining a huge splash image that fills the screen so LCP always looks fast. The number turns green and tells you nothing, because you can no longer see real regressions. Improve the experience, not the reading.
The other trap is chasing a perfect lab score. Lighthouse runs one simulated load, while your rating comes from the 75th percentile of real visits. Once field LCP is under 2.5 seconds, further gains are optional. Work on the phases with real delay, load delay and render delay, before you shave the rest.
LCP is the time it takes for the largest visible element to render, and Google calls 2.5 seconds or less at the 75th percentile good. The practical routine is short. Check field data, identify the LCP element, split the time into its four subparts, and fix the biggest overage first.
Speed work only pays off if you can trust what you measure. Bots that inflate sessions and distort analytics make it harder to tell whether faster pages are converting real shoppers. If that sounds familiar, see how Edge Protect filters bad bots before they reach your storefront, so your speed and conversion data reflects the people you want to reach.


