
A core web vitals audit comes down to five moves. Pick the pages that matter, read your field data at the site level, find the failing page groups in Search Console, diagnose each failing template with lab tools, then log your fixes and re-measure. Field data tells you what fails. Lab data tells you why. If you work in that order, you end up with a short, ranked list of pages to fix instead of a pile of scores.
Most audits go wrong in the first ten minutes. Someone runs one Lighthouse test on the home page, sees a performance score of 62, and starts tuning. But Google does not rank on that score, the home page is rarely the page that earns the money, and a single lab run says little about how real shoppers on mid-range phones experience your store. You end up fixing the wrong thing and cannot prove it worked.
This guide walks through the whole audit. You will learn the thresholds that define pass and fail, then six steps with the exact tools and screens to use: scoping, PageSpeed Insights, Search Console, lab diagnosis for LCP, CLS and INP, prioritizing, and validation. A worked example of a typical ecommerce store runs through every step.
A Core Web Vitals audit checks whether real visitors get a good experience on three measures: loading (LCP), responsiveness (INP) and visual stability (CLS). Google judges each one at the 75th percentile of real Chrome visits over a rolling 28 days. Everything in the audit exists to find where that number is bad and why.
Each metric has a "good" line. A page passes the assessment only when all three are good at the 75th percentile, meaning at least 75% of visits meet the threshold. Google publishes these thresholds on web.dev.
| Metric | What it measures | Good | Needs improvement | Poor |
|---|---|---|---|---|
| Largest Contentful Paint (LCP) | How fast the main content appears | 2.5 s or less | 2.5 to 4 s | Over 4 s |
| Interaction to Next Paint (INP) | How quickly the page responds to taps, clicks and key presses | 200 ms or less | 200 to 500 ms | Over 500 ms |
| Cumulative Layout Shift (CLS) | How much content jumps around | 0.1 or less | 0.1 to 0.25 | Over 0.25 |
INP replaced First Input Delay in March 2024, so any older audit template that lists FID is out of date. The 75th percentile rule matters because a page with an average LCP of 2.2 seconds can still fail if a quarter of visits are slow.
Field data comes from real Chrome users and is published in the Chrome User Experience Report (CrUX). It is what PageSpeed Insights and Search Console show, and it is the data Google's page experience guidance refers to. Lab data comes from a simulated load, such as Lighthouse, under fixed device and network settings.
Use each for its job. Field data decides whether a page has a problem and how big it is. Lab data lets you reproduce the problem, change something, and see the effect in seconds. A lab score of 95 next to a failing field LCP is common, and the field result wins every time.
CrUX has limits you should know before you start. It covers only a subset of Chrome users, so Safari and Firefox visitors are invisible. Low-traffic URLs often have no data at all, in which case PageSpeed Insights falls back to origin-level data or shows nothing. And because the window is 28 days, a fix you ship today moves the numbers slowly.
Are Core Web Vitals still worth auditing? Yes, but keep them in proportion. They are one input to Google's page experience signals, and strong content still outweighs them in search. The bigger payoff is usually conversion, because a slow or jumpy product page loses shoppers whatever Google does.
Field data tells you which pages fail; lab data only tells you why, so never start with the lab.
Start by deciding which URLs deserve the audit and what success means. For an ecommerce store, that is almost always a handful of page templates, not every URL. Auditing by template keeps the work small, because a fix to one product page template fixes thousands of URLs.
Write down why you are auditing. Rankings, customer complaints about slow pages, and abandonment in the funnel all point to different pages. Then list the templates that carry traffic and revenue.
Pull the real priorities from data. In Search Console's Performance report, sort pages by clicks. In GA4, sort landing pages by revenue or sessions. Pick 5 to 8 representative URLs, at least one per template, and add your best three landing pages from each source.
Keep every finding in one place so the audit survives a handoff. Copy this into a spreadsheet and fill one row per URL as you work through the steps.
URL | Template | Device | LCP (p75) | INP (p75) | CLS (p75) | Field pass? | LCP element | Root cause | Fix | Owner | Effort | Impact | Status
Record the date of each reading, because field numbers shift as the 28-day window moves. That date is also your baseline for Step 6.
An audit by page template beats an audit by URL, because one template fix repairs every page that uses it.
Open PageSpeed Insights, paste a URL, and read the top section called "Discover what your real users are experiencing" before you look at the performance score. That section is CrUX field data and carries the pass or fail verdict for your Core Web Vitals audit.

Run each URL from your list. PageSpeed Insights shows up to four views: mobile and desktop, each for "This URL" and for the whole origin. Record the three metrics at the 75th percentile for each into your sheet. Start with mobile, because it is usually the weaker view and the one most shoppers use.
Compare URL against origin. If a product page fails but the origin passes, your home page or fast pages are masking a template problem. If the origin fails and your home page passes, the home page is not representative. A "No data" message means the URL lacks enough traffic in CrUX, so move to the origin view and plan to rely on lab tests and your own real user data for that page.
The diagnostic metrics beside the three vitals narrow the cause before you open any other tool. Time to First Byte (TTFB) and First Contentful Paint (FCP) are milestones that come before LCP.
| What you see | Likely cause | Where to look next |
|---|---|---|
| High LCP and TTFB around 1.8 s | Slow server, no CDN, or redirects | Server response, caching, edge delivery |
| LCP much later than FCP | Main image or text discovered or rendered late | LCP element and its load path |
| Field CLS high, Lighthouse CLS near 0 | Shifts that happen after load | Scrolling and interaction in DevTools |
| Poor INP, low Total Blocking Time | A specific interaction is slow | Live metrics screen, click through key actions |
| Poor INP, high Total Blocking Time | Heavy JavaScript at load | Third-party scripts, long tasks |
An example makes this concrete. Say your product pages on mobile show LCP 3.4 s, INP 180 ms and CLS 0.14, with TTFB at 1.4 s. That page fails on two of three metrics. INP is fine, so you will spend your effort on LCP and CLS, and the 1.4 s TTFB tells you that over half your LCP budget is gone before the browser receives the HTML.
Testing URLs one by one gets tedious past a dozen pages. The PageSpeed Insights API returns the same field and lab data programmatically, and crawlers such as Screaming Frog SEO Spider can call it for every URL they find. Use that to sweep your templates, then still do the careful reading on the worst offenders by hand.
Read the "real users" box first, and treat the performance score as a hint at best.
Search Console shows which groups of your pages fail, which turns a few test URLs into a site-wide picture. You find it under Experience, then Core Web Vitals in the left menu. It is the best tool in a Core Web Vitals audit for deciding where to spend developer time, and it is free for verified site owners.
The report opens with two charts, one for mobile and one for desktop, counting URLs as Poor, Needs improvement or Good. Click Open report on a chart, then click an issue such as "LCP issue: longer than 2.5s (mobile)". You get a list of URL groups, each with a population (how many similar URLs it contains) and a group metric value.
Click a group to see example URLs. The top of the list often includes pages with their own URL-level data, and those are your high-traffic pages. Add them to the audit sheet. Check the status per metric, because a group can fail LCP while passing CLS and INP.
Groups are built by similarity, and they are not always intuitive. A group can fail overall while its example pages all look fine, usually because a long tail of rarely visited pages loads slowly with cold caches. Do not dismiss the group. Test a few of the least visited URLs in it and see whether they differ, for instance by missing a cached image or carrying more embedded content.
Also remember that Search Console reports only indexed URLs with enough CrUX data. Pages that do not appear are not necessarily healthy. They may simply lack data.
Work through the report in this order:
In the store example, suppose mobile shows "Product pages, 1,200 similar URLs" failing LCP and CLS, and "Collection pages, 80 URLs" failing LCP only. Product pages go first.
Search Console tells you where a problem lives across the site, so use it to choose which templates get fixed first.
Now you reproduce each failing metric on the example URLs and find the cause. Use Lighthouse in PageSpeed Insights for a repeatable baseline, and the Performance panel in Chrome DevTools for detail. Always confirm that the lab run shows the same kind of problem your field data showed. If it does not, you are looking at the wrong thing.
First, find the LCP element. In PageSpeed Insights it appears in the diagnostics, and in DevTools the Performance panel marks it in the timings track. It is usually a hero image or product photo, sometimes a block of text.
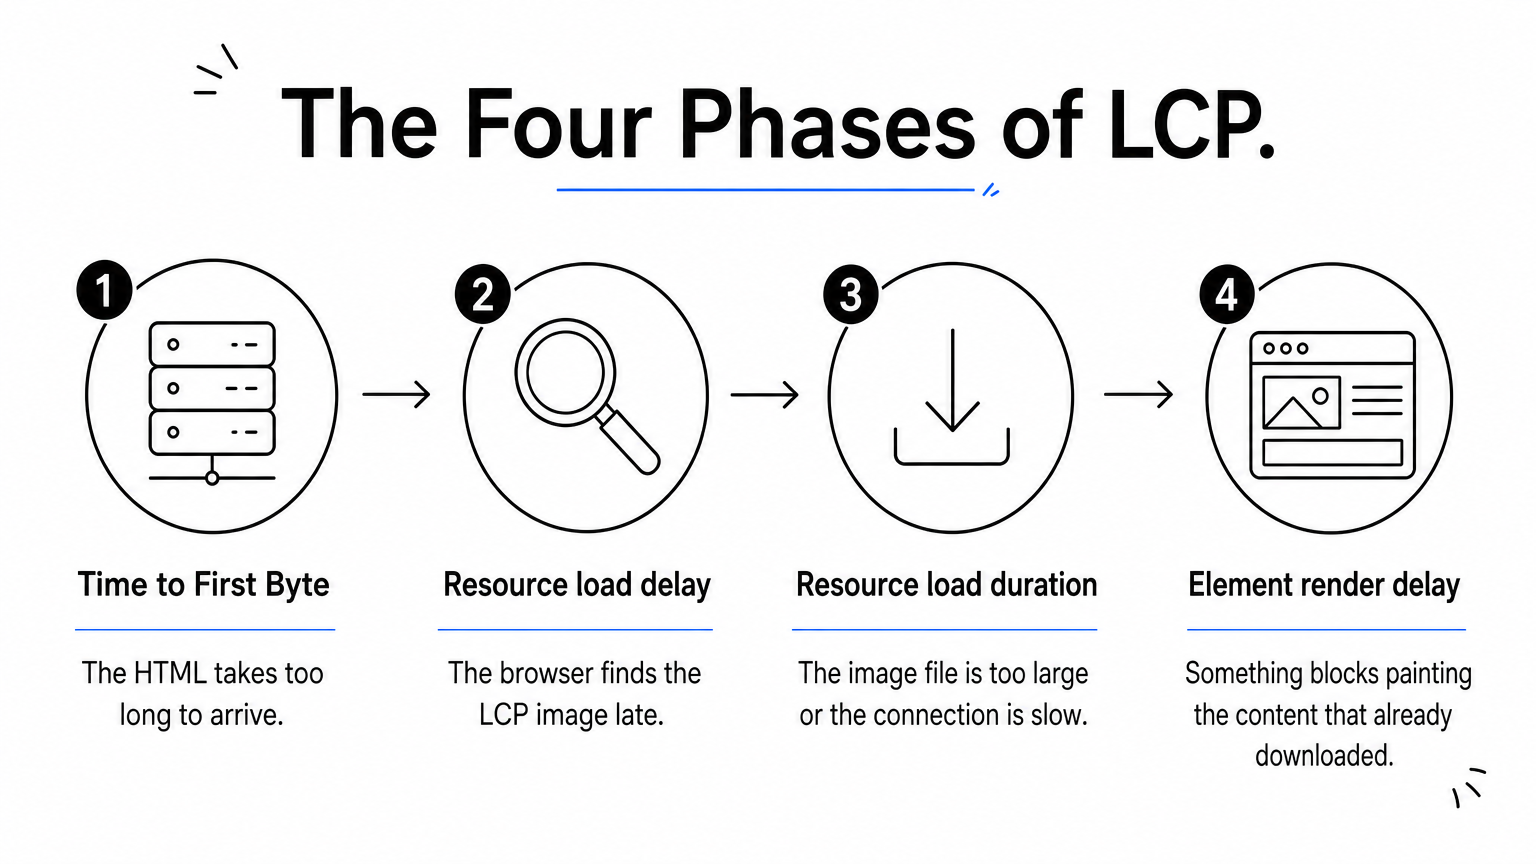
Then look at the LCP phases, which split the time into four parts:
Google's guidance on web.dev suggests a healthy page spends roughly 40% in TTFB, 40% in load duration, and under 10% each in the two delays. If your delay phases are large, you have a discovery or blocking problem, and compressing the image will not help. Check the network waterfall for which requests block rendering and when the LCP resource starts. A hero image with loading="lazy" is a frequent culprit, as is an image that is only requested after a script runs.
Open the "Avoid large layout shifts" audit in Lighthouse, or the Layout Shifts track in the DevTools Performance panel, to see which elements moved. Then ask what triggered the move. The usual suspects on storefronts:
Lighthouse only watches the page load, so it misses shifts that happen when you scroll or tap. If your field CLS is high but Lighthouse shows almost nothing, open the live metrics view in the DevTools Performance panel, then scroll the full page, open menus, switch product variants and watch for shifts. Test once in a clean incognito window, because consent banners behave differently for first-time visitors.
INP is the hardest metric to audit in the lab. Lighthouse cannot click anything, so use Total Blocking Time as a rough hint about heavy scripts, and use the live metrics screen in DevTools to measure real interactions. Click the things shoppers click: add to cart, open the menu, pick a size, apply a filter. The interaction that shows the longest delay is your suspect.
Record a trace of that interaction in the Performance panel. Long tasks are flagged with red triangles in the flame chart. Check which scripts run. Tag managers, analytics snippets, chat tools and review widgets are common sources, and the script names in the trace tell you who owns them.
To get this data from real visitors, Google's web-vitals library reports attribution details. This snippet logs what slowed each metric down. Replace console.log with a call to your analytics endpoint in production.
import {onLCP, onINP, onCLS} from 'web-vitals/attribution';

function report(metric) {
  console.log(metric.name, metric.value, metric.attribution);
}

onLCP(report);
onINP(report);
onCLS(report);
Match each lab finding to the failing field metric, or you will fix a problem your visitors never had.
Turn your findings into a ranked list by scoring each one for expected impact and for effort, then fix the high-impact, low-effort items first. A Core Web Vitals audit that ends as a list of 40 equal-weight issues rarely gets implemented. One that ends with five ranked actions does.
Take each root cause from your sheet and score it. Impact means how much it should move a failing metric across many pages. Effort means how many people and weeks it needs. Here is how the findings from the example store might rank.
| Finding | Template | Metric | Effort | Impact | Priority |
|---|---|---|---|---|---|
| Hero image lazy-loaded and not preloaded | Product | LCP | Low | High | 1 |
| Shipping banner injected after load | All | CLS | Low | Medium | 2 |
| Images missing width and height | Product, collection | CLS | Low | Medium | 3 |
| Third-party widget blocks main thread | All | INP | Medium | Medium | 4 |
| Slow HTML response, no edge caching | Collection | LCP | High | High | 5 |
Fixes fall into three buckets. Quick fixes are template or setting changes you can ship this sprint. Vendor fixes depend on a third party, so decide whether the script earns its place or whether you can load it on fewer pages. Platform fixes, like slow server response, are the largest projects.
Slow HTML delivery is where an edge layer helps without a rebuild. Nostra AI's Dash speed agent accelerates pages at the edge and needs only a DNS-level change, with no code changes. Nostra reports up to 47% faster load times, with full acceleration after about two weeks. It will not repair a shifting banner or a heavy third-party script, so treat it as one fix among several.
Whoever reads the audit needs a decision, not a data dump. Keep the write-up to one page:
A screen recording of a slow load or a layout jump persuades stakeholders faster than a table of numbers.
A ranked list of five fixes gets shipped; an unranked list of forty gets filed away.
After you ship fixes, confirm them in the lab at once, then confirm them in field data over the following weeks. Lab tests tell you whether the change worked on your machine. Field data tells you whether it worked for shoppers. Skipping the second check is how a regression goes unnoticed for months.
Re-run the same URLs in PageSpeed Insights and DevTools right after deploying and compare against your baseline row. Then wait for CrUX. Because the data is a rolling 28-day window, the numbers improve gradually and a full result takes about four weeks. In Search Console, open the failing issue and click Validate fix so Google tracks whether the URLs recover. Validation can take up to 28 days, so do not read a pending status as a failure.
If you collect your own field data with the web-vitals library or a monitoring service, you see changes within days. That is the fastest way to confirm an INP fix, since INP is the hardest metric to reproduce in the lab.
Run the full audit monthly, and a short check after every large release, theme update or new third-party script. Add Lighthouse CI to your build pipeline if you have developers, so a change that slows the page is caught before it reaches production. Keep your audit sheet and add a dated column each round.
One more point on data quality. Bot traffic can inflate sessions and skew your own analytics and real user monitoring, which makes trends harder to trust. Filter it out before you draw conclusions from your own numbers. CrUX is based on real Chrome users, so it is not affected in the same way.
Fixes are only proven when field data moves, so schedule the re-check before you close the ticket.
A good Core Web Vitals audit is a loop. Define the templates that matter, read field data in PageSpeed Insights, find failing groups in Search Console, diagnose them in the lab, rank the fixes, and measure again after 28 days. The scores matter less than the habit of checking them against real visitors.
Cleaner data makes every one of those steps easier to trust. If bots are inflating your sessions and muddying your analytics while you audit, Edge Protect filters malicious bot traffic before it reaches your storefront, so the numbers you act on reflect real shoppers.


